A troubleshooting pod was set up in the container environment, based on the nicolaka/netshoot image, which is a Docker + Kubernetes network troubleshooting Swiss-army container.

Additional diagnostic were added, creating a powerful and versatile one-stop troubleshooting toolbox and enabling more convenient and efficient debugging of the environment. The installation is complete for the following tools:
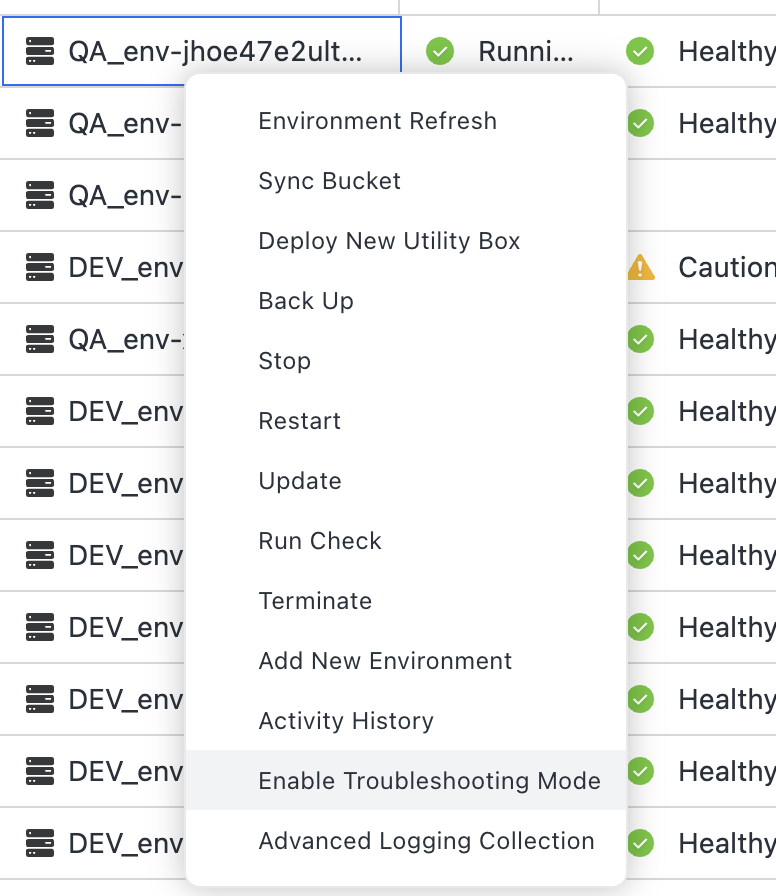
2. Enter the backend of your environment cluster.
a. At first, enter the cluster backend.
# set namespace
b. kubectl config set-context --current --namespace=<env_namespace>
# enter the box
c. kubectl exec -it <troubleshoot pod> -- /bin/bash
For example, the code to connect to pg automatically is shown below.
chmod +x access_to_db.sh
./access_to_db.sh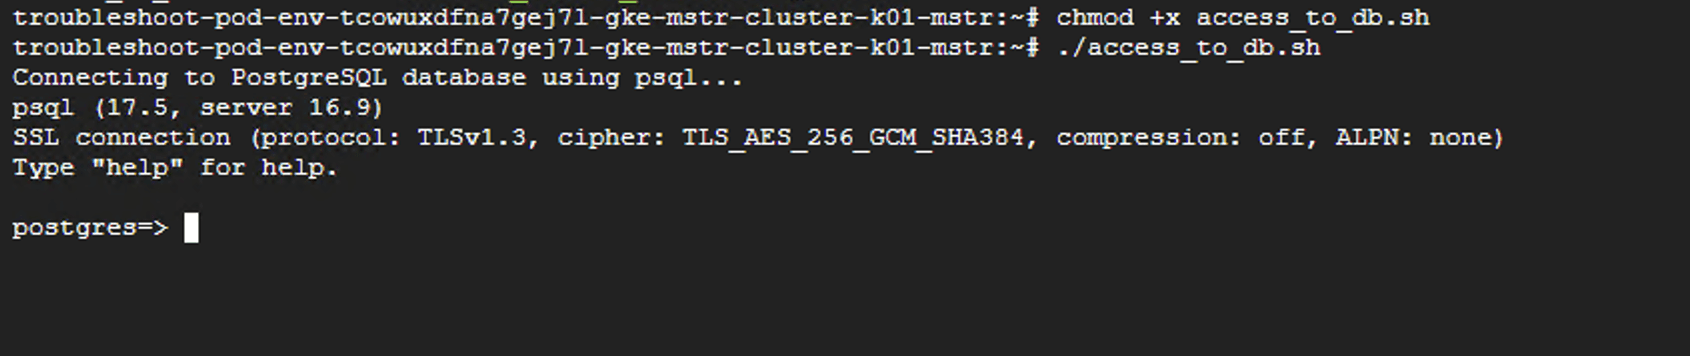
Package | Description |
strace | Trace application system calls and kernel interactions |
ltrace | Trace dynamic library function calls made by applications |
opensnoop | Real-time tracing of file open events |
lsof | List the files opened by processes |
fatrace | File access tracing tool |
filelife | Monitor file lifecycle events |
pcstat | Inspect file cache statistics |
Package | Description |
perf | Comprehensive performance analysis tool |
Ftrace | Linux kernel tracing framework for analyzing kernel events |
LTTng | High-performance tracing framework for distributed systems |
BCC | BPF tools for dynamic kernel performance analysis |
bpftrace | Lightweight, dynamic tracing with BPF-based tools |
gethostlatency | Monitor the latency of gethostbyname() system calls |
execsnoop | Track exec() system calls |
Package | Description |
iostat | Monitor CPU and device I/O usage |
biosnoop | I/O scheduling analysis tool |
biolatency | Track I/O request latency |
biotop | Real-time display of block device I/O activity |
blktrace | Trace I/O operations on block devices |
Package | Description |
mdflush | Monitor flush operations on storage devices |
swapon | Observe activities on swap partitions |
Package | Description |
AWS CLI | AWS cloud management and operations tool |
azure-cli | Microsoft Azure cloud management tool |
gcloud | Google Cloud Platform management CLI |
psql | Command-line client for managing PostgreSQL |
redis-cli | Command-line client for managing Redis |
Package | Description |
nicstat | Monitor network interface statistics |
netstat | Display network connections, sockets, and network stats |
ip | Network configuration and statistics |
ethtool | Display and configure network interface parameters |
lldptool | Configure and monitor LLDP (Link Layer Discovery Protocol) |
Package | Description |
tcpdump | Capture and analyze network packets |
tcplife | Display the lifecycle of TCP connections |
tcptrans | TCP data transmission analyzer |
udpconnect | UDP connection network observability |
Package | Description |
snmpget | SNMP querying and monitoring tool |
Package | Description |
profile | Analyze process scheduling and CPU usage |
mpstat | Display CPU usage statistics |
offcputime | Show non-CPU-consuming time, such as waiting time |
softirqs | Monitor CPU core soft interrupt activity |
Package | Description |
vmstat | Comprehensive performance statistics for memory, CPU, and I/O |
slabtop | Monitor SLAB allocator performance |
free | Display memory usage statistics |
numastat | Show NUMA node memory statistics |
Package | Description |
turbostat | Advanced CPU performance statistics |
showboost | Display CPU performance boost modes |
rdmsr | Read CPU-specific registers |
Package | Description |
numastat | Display NUMA node memory statistics |
Package | Description |
iostat | I/O usage statistics |
biosnoop | Trace disk I/O scheduling behavior |
biolatency | Measure latency for I/O operations |
biotop | Real-time block device I/O monitoring |
Package | Description |
nicstat | Network interface throughput analysis |
netstat | Monitor network connections and sockets |
ethtool | Monitor and configure network device settings |
snmpget | SNMP querying tool |
lldptool | Link Layer Discovery Protocol tool |
Package | Description |
sar | Collect and display system performance statistics |
dmesg | Display kernel messages |
dstat | Comprehensive system performance monitor |
top | Display real-time system and process resource usage |
atop | Similar to top, with extended history and resource details |
pidstat | Show detailed process performance statistics |
