EducationSoftwareStrategy.com
StrategyCommunity

Knowledge Base

Product

Community

Knowledge Base

TopicsBrowse ArticlesDeveloper Zone

Product

Download SoftwareProduct DocumentationSecurity Hub

Education

Tutorial VideosSolution GalleryEducation courses

Community

GuidelinesGrandmastersEvents
x_social-icon_white.svglinkedin_social-icon_white.svg
Strategy logoCommunity

© Strategy Inc. All Rights Reserved.

LegalTerms of UsePrivacy Policy
  1. Home
  2. Topics

KB6296: How to Drill on Compound Metrics in Grid and Graph reports with MicroStrategy Desktop/Developer 9.4.1/10.x


Stefan Zepeda

Salesforce Solutions Architect • Strategy


This article describes how to drill on compound metrics in grid and graph reports with MicroStrategy Desktop/Developer 9.4.1/10.x

In Strategy Desktop/Developer 9.4.1/10.x, if there are any compound metrics included in the interface, users may click on the word Metrics, and that will break down all compound metrics into its constituent simple metrics. The examples below describe how to drill on these compound metrics on both grid and graph reports.
 
Follow these steps to Drill on a Compound metric in Grid mode:
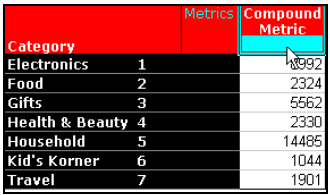
  • Create a compound metric through the Metric Editor.
  • Create a new report using the Compound metric created above.
  • Execute the report.
ka02R000000kbukQAA_0EM440000002GCI.gif
  •  
    The Formula for Compound Metric 1 is:
    (Discount + (Freight * ))
  • Right-click on the Metrics header. All the metrics in the report will be highlighted
ka02R000000kbukQAA_0EM440000002GCE.gif
  • Select the Drill option.
    Drilling will be performed and the compound metric will break up into its constituent simple metrics and all of them will be shown in the report with a column for each of them.
ka02R000000kbukQAA_0EM440000002GCF.gif
  •  
    In the example above, the Compound Metric has been broken by all its constituent simple metrics.

 
Follow these steps to Drill on a Compound metric in Graph mode:

  • Execute a report containing a Compound Metric.
  • Switch the Report Results to Graph mode.
ka02R000000kbukQAA_0EM440000002GCH.gif
  • Right-click on the Legend for the Compound Metric and select 'Drill on (Compound Metric Name)'.
ka02R000000kbukQAA_0EM440000002GCC.gif
  • After the drilling occurs, a new graph instance will be opened indicating the values for each of the simple metrics used for the calculation of the Compound Metric that was drilled upon.
ka02R000000kbukQAA_0EM440000002GC7.gif
  •  
    In the example above, the Compound metric, which is composed of the Discount, Freight and Dollar sales Running Average simple metrics, was broken down so that each attribute element in the row axis displays the value for each of the simple metrics. Green for Discount, Brown for Freight and light blue for Dollar sales Running Average.
     
    It is also possible to keep the column for the original Compound Metric in the drilled results. This is done by selecting the Keep Parent option in the Drill dialog box. The drill dialog box is accessed by selecting the Drill option under Data in the report editor menu bar. (Data > Drill)
ka02R000000kbukQAA_0EM440000002GCG.gif
  •  
    The results keeping the Parent Compound Metric in the drilled report should appear similar to the following:
ka02R000000kbukQAA_0EM440000002GCD.gif

Comment

0 comments

Details

Knowledge Article

Published:

June 6, 2017

Last Updated:

June 6, 2017