In MicroStrategy OLAP Services, an Aggregation NULL is generated when a metric cannot be aggregated to a higher level in a report view. This happens because the Analytical Engine cannot raise the level of the metric due the nature of the aggregate function.
EXAMPLE:Considering the following fact table:
[fact_table]
Year_ID | Month_ID | Region_ID | Store_ID | SALES |
2001 | 200111 | A | m | 68 |
2001 | 200111 | A | n | 37 |
2001 | 200112 | A | m | 129 |
2002 | 200201 | A | n | 64 |
2002 | 200201 | B | o | 14 |
2002 | 200205 | B | p | 68 |
2002 | 200210 | B | o | 23 |
2002 | 200210 | B | p | 36 |
The level of this fact table is store and month. The reason is that, store and month are the attributes at the lowest level in their hierarchy (time and geography). In a well-designed table, the combination of the lowest level attributes should be a primary key for each record:

Thus, a metric defined as Sum(SALES) inside an ICube that contains year, month, region and store returns the following results when all the attributes are shown on the report display:
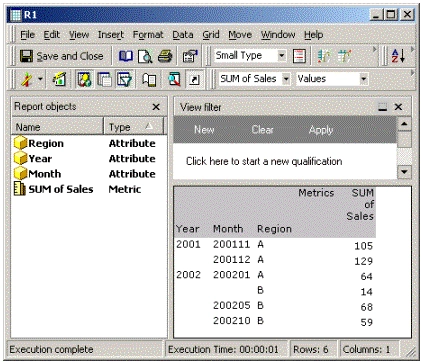
Levels Summary | |
Fact Table | month, store |
ICube | month, region |
Report View | month, region |
If an attribute from the ICube's lowest level (month, region) is removed from the report view, the Analytical Engine needs to roll the value up to the new dimensionality of the report view. In this case, if month is removed, the metric needs to be re-aggregated at the year, region level (new lowest level for the view):
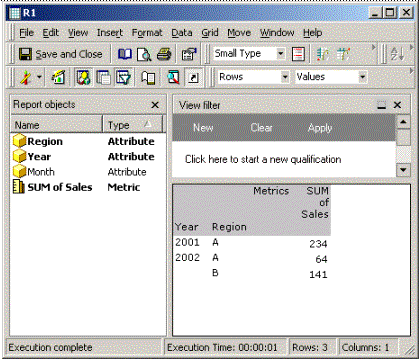
Levels Summary | |
Fact Table | month, store |
ICube | month, region |
Report View | year, region |
It is important to remember that the level of the displayed data has changed, but not the level of the ICube. The ICube's lowest level is still month, region. The level of the view is year, region now.
In contrast, a metric defined as Avg(SALES) behaves differently:

Levels Summary | |
Fact Table | month, store |
ICube | month, region |
Report View | month, region |
If all the attributes are shown on the template, the data will be displayed for both metrics. Nevertheless, if an attribute from the ICube's lowest level (month or region) is removed from the report view the data cannot be re-aggregated for the [avg of sales] metric (for example, month is removed):
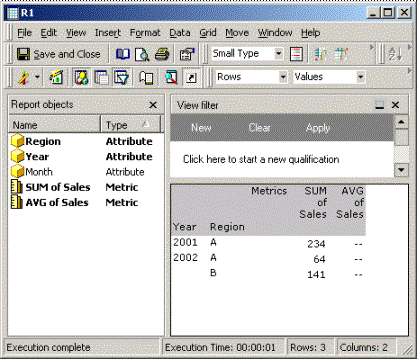
Levels Summary | |
Fact Table | month, store |
ICube | month, region |
Report View | year, region |
The metric [avg of sales] cannot be re-aggregated at the year, region level. This is due to the fact that the cube already has the average of the value from the warehouse at the month, region level.
When month is removed from the report view, it is not possible to re-aggregate this value. This is due to the fact that the average of sales at the year, region level is not the same as the average at the year, region level of the average at the month, region level.
[fact_table]
Year_ID | Month_ID | Region_ID | Store_ID | SALES |
2001 | 200111 | A | m | 68 |
2001 | 200111 | A | n | 37 |
2001 | 200112 | A | m | 129 |
2002 | 200201 | A | n | 64 |
2002 | 200201 | B | o | 14 |
2002 | 200205 | B | p | 68 |
2002 | 200210 | B | o | 23 |
2002 | 200210 | B | p | 36 |
The average of sales at the month, region level is the following:
Month_ID | Region_ID | SALES | Avg(SALES) {month, region} |
200111 | A | 68 | 52.5 = ( / 2) |
200111 | A | 37 | |
200112 | A | 129 | 129 = (129 / 1) |
200201 | A | 64 | 64 = (64 / 1) |
200201 | B | 14 | 14 = (14 / 1) |
200205 | B | 68 | 68 = (68 / 1) |
200210 | B | 23 | 29.5 = ( / 2) |
200210 | B | 36 |
The average of sales at the year, region level is the following:
Year_ID | Region_ID | SALES | Avg(SALES) {year, region } |
2001 | A | 68 | 78 = ( / 3) |
2001 | A | 37 | |
2001 | A | 129 | |
2002 | A | 64 | 64 = (64 / 1) |
2002 | B | 14 | 35.25 = ( / 4) |
2002 | B | 68 | |
2002 | B | 23 | |
2002 | B | 36 |
NOTE: The average of sales at the year, region for 2001/A is 78 = ((68+37+129) / 3). And not the average of the average: 90.75 = ((52.5+129) / 2).
Since the values that the ICube already has, from the SQL execution, is the average of the values existing in the fact table, it is not possible for the Analytical Engine to re-aggregate this value. Consequently, two dashes (--) appear.
If, in any case, users want to override this behavior and show a certain aggregation for the metric, the 'Dynamic aggregation function' can be manually defined inside the metric editor under the 'Subtotals / Aggregation' tab. In this case, the 'Average' function is defined for the [avg of sales] metric:

With this change, the [AVG of Sales] metrics shows the following values:

Levels Summary | |
Fact Table | month, store |
ICube | month, region |
Report View | year, region |
The previous results can be defined with the following formula:
Avg(Avg(SALES) {month, region }) {year, region }
Month_ID | Region_ID | SALES | Avg(SALES) {[Month], [Region]} | Avg(Avg(SALES) {[Month], [Region]}) {[Year], [Region]} |
200111 | A | 68 | 52.5 = ([68 + 37] / 2) | 90.75 = ([52.5 + 129] / 2) |
200111 | A | 37 | ||
200112 | A | 129 | 129 = (129 / 1) | |
200201 | A | 64 | 64 = (64 / 1) | 64 = (64 / 1) |
200201 | B | 14 | 14 = (14 / 1) | 37.16 = ([14 + 68 + 29.5] / 3) |
200205 | B | 68 | 68 = (68 / 1) | |
200210 | B | 23 | 29.5 = ([23 + 36] / 2) |
In conclusion:
Avg(Avg(SALES) {month, region }) {year, region } ≠ Avg(SALES) {year, region }
Important Note:MicroStrategy product suite only shows values for this type of metrics if, and only if all the attributes from the ICube are present on the report view, regardless of their level.
EXAMPLE:
This report shows all the data for the [avg of sales] metric since all the attributes from the ICube are present on the report view. | |
If the year attribute is removed from the view, the metric displays two dashes (--) even though the values should remain unchanged since the attribute that was removed is from a higher level. |
NOTE: The most common functions that show this behavior are: Avg and Count (Distinct). Sum, Min, Max and Count functions are not affected by this behavior. The reason is that only double aggregatable functions can safely have an aggregation function assumed. Compound metrics that do not use a Sum, Min, or Max function are affected by this behavior as the outermost function isn't an aggregation function so it is again not double aggregatable.
