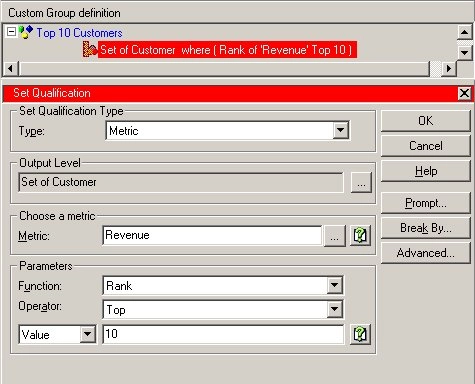
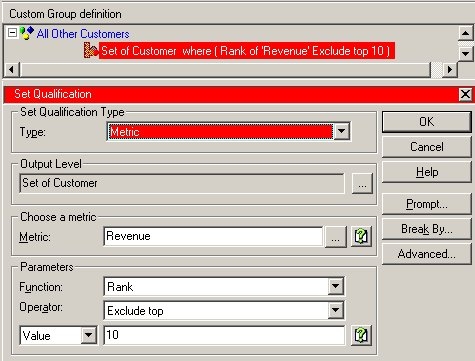
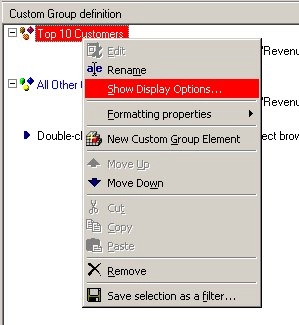
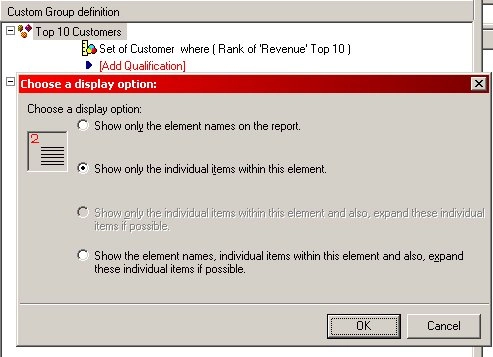
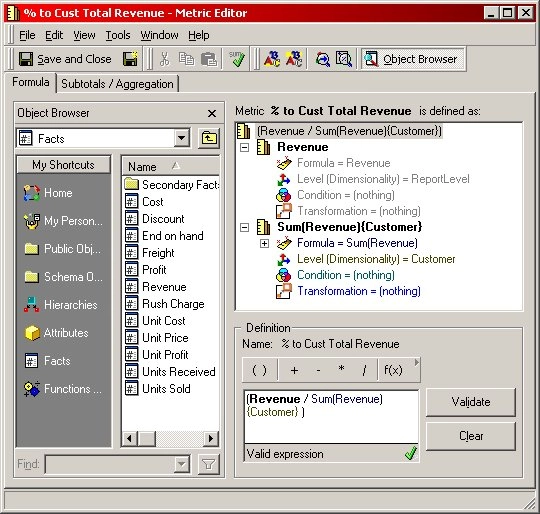
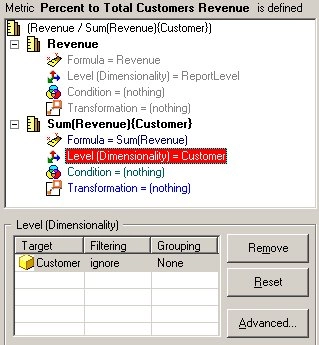
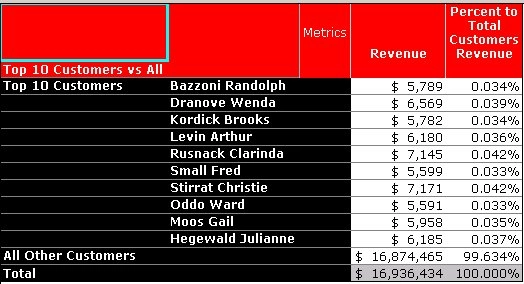
Users can create a report which displays the top ten contributors versus all other contributors by use of custom groups. This 'Top 10 Customers vs All' custom group will have two elements. One element will show the top ten customers and another element will show all customers.
Using the Strategy Tutorial project, perform the following steps to achieve this:
KB8429