EducationSoftwareStrategy.com
StrategyCommunity

Knowledge Base

Product

Community

Knowledge Base

TopicsBrowse ArticlesDeveloper Zone

Product

Download SoftwareProduct DocumentationSecurity Hub

Education

Tutorial VideosSolution GalleryEducation courses

Community

GuidelinesGrandmastersEvents
x_social-icon_white.svglinkedin_social-icon_white.svg
Strategy logoCommunity

© Strategy Inc. All Rights Reserved.

LegalTerms of UsePrivacy Policy
  1. Home
  2. Topics

KB8813: How to create a Percent to Total metric without OLAP Services permissions in Microstrategy Developer


Stefan Zepeda

Salesforce Solutions Architect • Strategy


How to create a Percent to Total metric without OLAP Services permissions in Microstrategy Developer

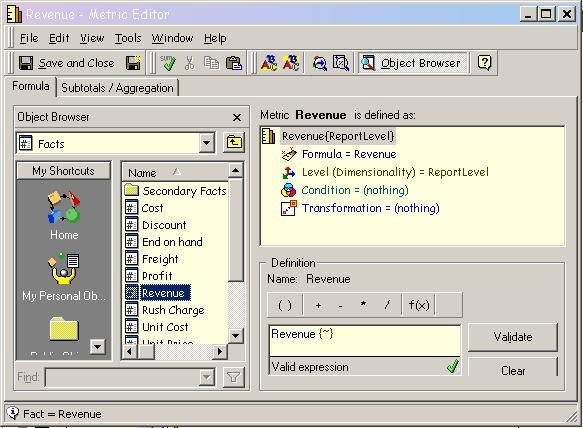
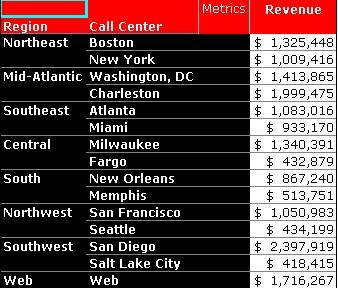
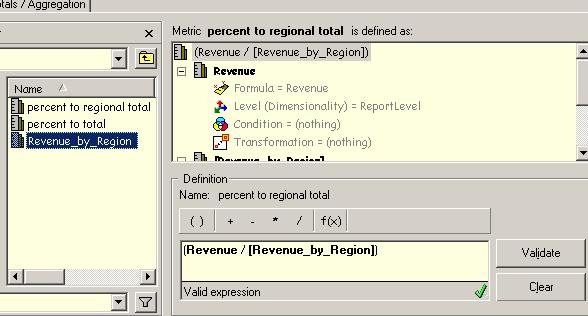
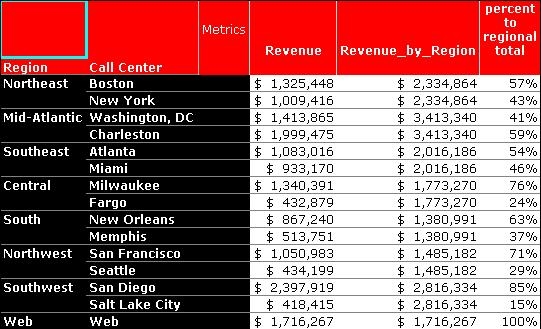
Although users with permissions to use Strategy OLAP Services can more easily create "Percent to Total" metrics on the report grid, other users who don't use Strategy OLAP Services may also create a "Percent to Total" metric. To achieve this, the user must have three metrics.
 

  • Create a regular metric with report level aggregation:
     
    Note: By default, this metric is calculated at the report level, i.e. the aggregation is matched to the lowest level attribute in the report. Typically, this type of metric is created by dragging and dropping a fact as shown below:
     
ka02R000000kZivQAE_0EM440000002G4G.jpeg
  •  
    Using the above metric, consider the following example. This report contains the report level metric to calculate the revenue contribution of the each call center to the region:
     
ka02R000000kZivQAE_0EM440000002G4M.jpeg
  • Create a level metric that aggregates at the desired level (i.e. the level of the total).
     
    In this metric example, the user needs to calculate the revenue at the region level. This metric will serve as the denominator for the percent to total metric. To create this metric, perform the following steps:
     
    • Create a regular metric with report level aggregation as discussed earlier.
    • Highlight the "Level" option.
    • Find the Region attribute from the data explorer and drag and drop into the level definition list.
    • Change the filter to "ignore" and grouping to "standard".
    • Save and Close.
ka02R000000kZivQAE_0EM440000002G4H.jpeg
  •  
    Users can also select any attribute for the grouping as long the attribute is not lower than the lowest level shown in the template.
     
    Next, bring the metric into the report. Notice the "Revenue_by_Region" metric aggregates the total number of each region:
     
ka02R000000kZivQAE_0EM440000002G4I.jpeg
  • Create a compound metric based on the previous two metrics, "Revenue" (Call Center Level) and "Revenue_by_Region" (Region Level).
     
    This compound metric will be a "Percent to Regional Total" and created as follows:
     
ka02R000000kZivQAE_0EM440000002G4E.jpeg
  •  
    Bring the "Percent to Regional Total" metric into the report. Make sure to change the format to "%".
     
ka02R000000kZivQAE_0EM440000002G4F.jpeg

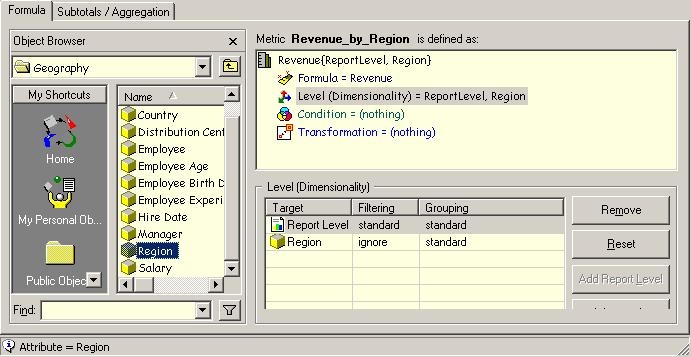
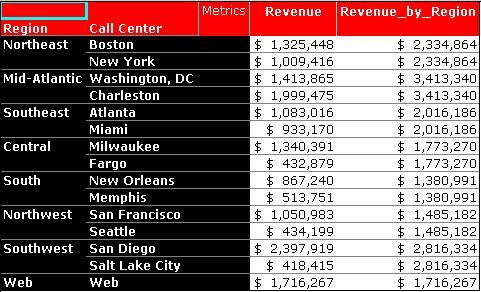
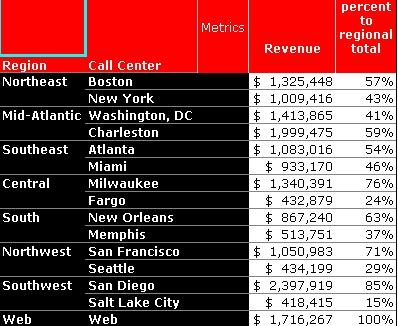
Note: If the "Revenue_by_Region" is not required on the template, removing it will still generate correct results on the report:
 

ka02R000000kZivQAE_0EM440000002G4L.jpeg

 
For more example of advanced metrics, refer to the following Strategy Knowledge Base documents:
 

  • KB4000-7X0-0359 - How to create a metric that counts non-buying customers in the Strategy 7.x Product Suite
  • KB4000-7X0-0312 - How to create a report with percent-to-total information for different bands using Custom Groups in Strategy Agent 7.0

For information on Strategy OLAP Services and the "Percent to Total" functionality, refer to the following Strategy Knowledge Base document:
 

  • KB4000-721-0914 - Derived Metric functionality is not available in Strategy Desktop 7i - 7.2.1

Comment

0 comments

Details

Knowledge Article

Published:

June 8, 2017

Last Updated:

June 8, 2017