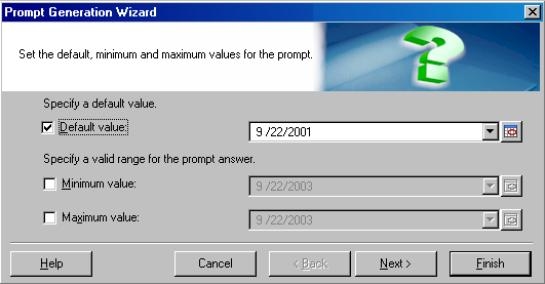
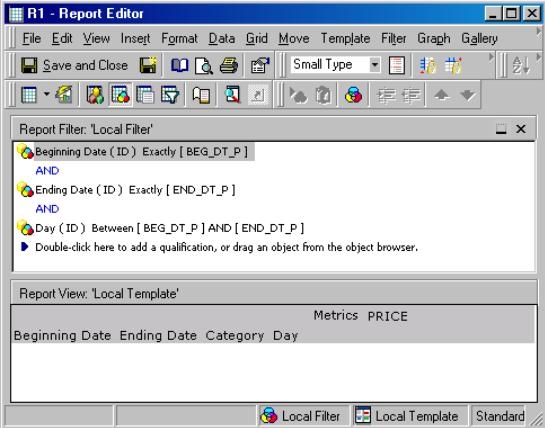
Consider that a user requires a report which will prompt on a range of dates and the data on this report must display the date range in the leftmost columns.
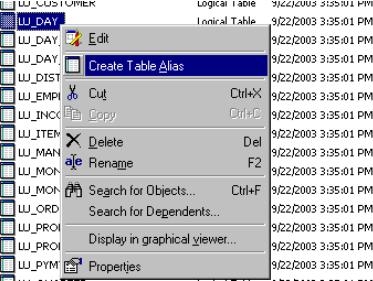
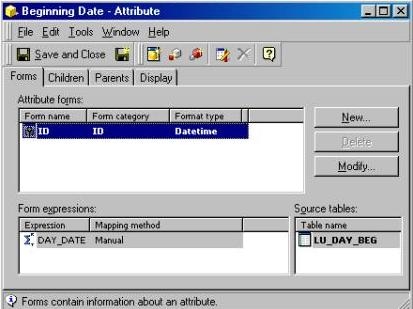
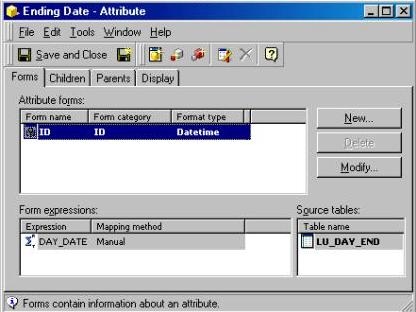
The following procedure will use the Strategy Tutorial project to illustrate how to create a report which will display the beginning and ending values for a date range:
The report returns the following in Grid view:
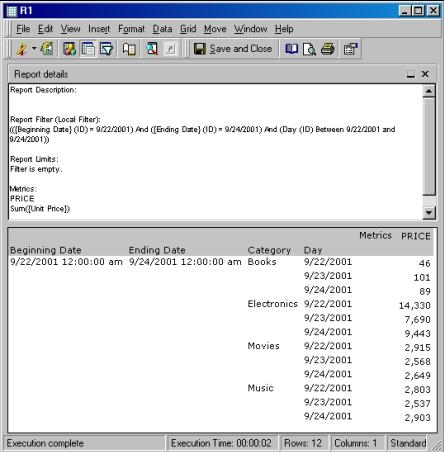
Below is the SQL view for the same report:
select a12.DAY_DATE DAY_DATE,
a13.DAY_DATE DAY_DATE0,
a15.CATEGORY_ID CATEGORY_ID,
max(a16.CATEGORY_DESC) CATEGORY_DESC,
a11.ORDER_DATE DAY_DATE1,
sum(a11.UNIT_PRICE) PRICE
from
cross join
cross join
join
on (a11.Item_Id = a14.Item_Id)
join
on (a14.SUBCAT_ID = a15.SUBCAT_ID)
join
on (a15.CATEGORY_ID = a16.CATEGORY_ID)
where (a12.DAY_DATE = '2001-09-22'
and a13.DAY_DATE = '2001-09-24'
and a11.ORDER_DATE between '2001-09-22' and '2001-09-24')
group by a12.DAY_DATE,
a13.DAY_DATE,
a15.CATEGORY_ID,
a11.ORDER_DATE
Notice that there are two cross joins against the LU_DAY table, once for each one of the new date attributes. This is because there is no parent-child relationship to the other objects on the report. Nevertheless, the results are correct and performance should not be affected since the cross join is limited to only one date for each table.