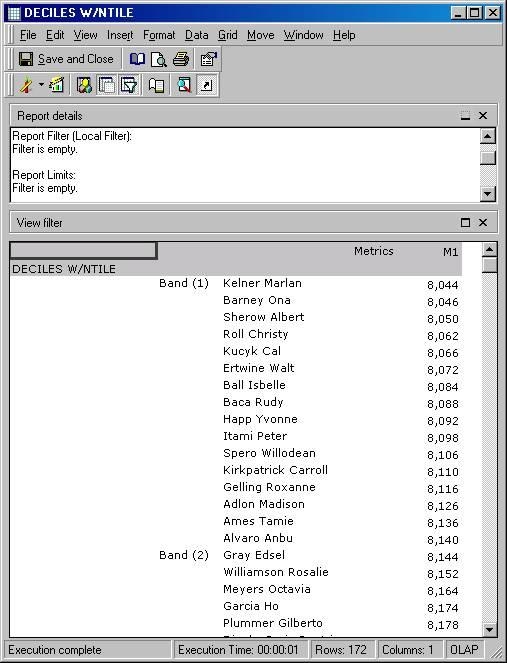
This document uses the Strategy Tutorial project to illustrate how to arrange information in Deciles in Strategy Developer 9.x:
Metric:
M1 = Sum(Revenue) {~+}
Filter:
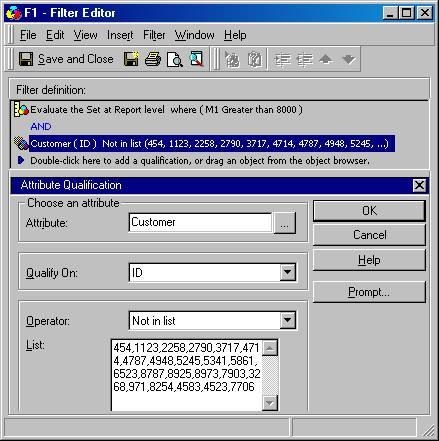
F1 = M1 > 8000 And Customer ID NOT in list (454, 1123, 2258, 2790, 3717, 4714, 4787, 4948, 5245, 5341, 5861, 6523, 8787, 8925, 8973, 7903, 3268, 971, 8254, 4583, 4523, 7706)
Note: This filter ensures that the report below only returns 161 rows.
Report:
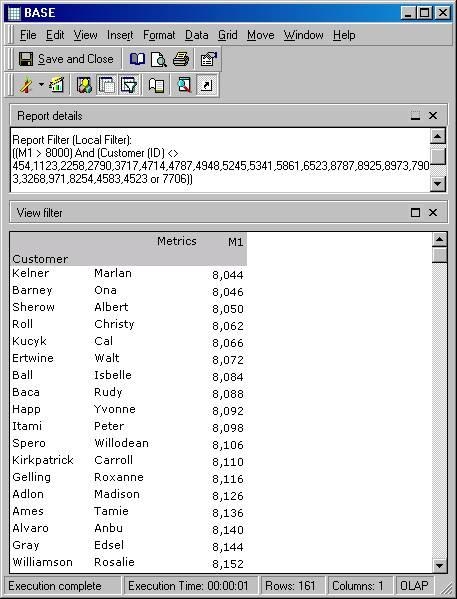
The following report returns 161 Customers that are not included in the filter's list and generate revenue greater than 8000. All the values for M1 are unique and are sorted in ascending value:
To create a set of deciles based on the amount of sales for each costumer, create the following objects:
Metrics:
= Sum(Revenue) {~+} <>
= NTile()
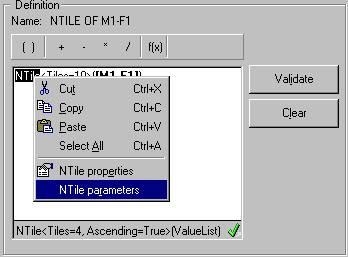
The NTile function has a parameter, Tiles, which determines how many groups will divide the input data. For deciles, 10 groups are needed so Tiles should be set to 10. After validating the formula, the parameter may be set by right-clicking on the NTile function and choosing "NTile parameters."
Custom Group:
Create a custom group with one custom group element that uses a banding qualification on the value of the metric. Use start on 1, stop at 10 and a step size of 1. Set the level to .
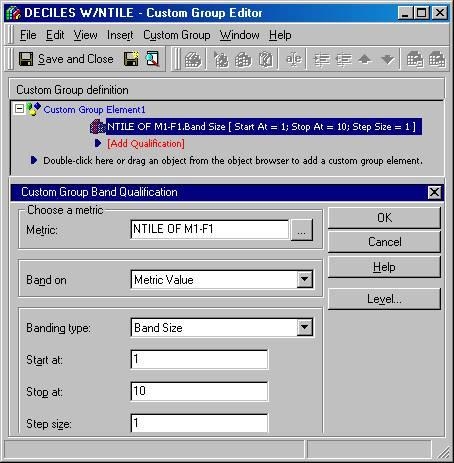
The following report will then return 10 bands. The first 9 will contain 16 elements and the last band will contain 17 (161 rows total). Strategy reports 172 rows because it considers the custom group total (1) and each band subtotal (10) in their own row.