In many cases, users may want their Report Services document to display a grid that combines data from multiple datasets.
The following procedure will serve as an example to describe how to achieve this functionality and will use the grid shown below as the model:
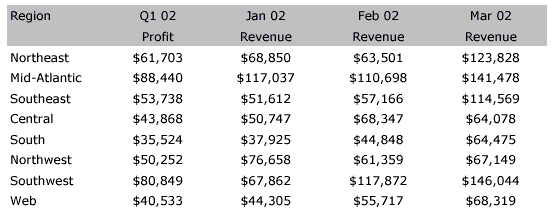
In this example, it is necessary to format the grid to display quarterly and monthly data in adjacent columns. Perform the following steps to create such a grid:
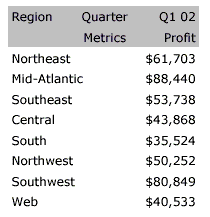
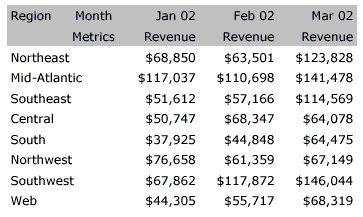
The final grid will be created by joining Grids A and B. The 'Region' attribute must be added to 'Grid B' in order to achieve the desired aggregation but the row headers should now be displayed in Portable Document Format (PDF). To achieve this:
