Users may wish to create a report that displays only a subset of data chosen at random from a given dataset. This article explains how users can create a metric that generates a random value for each row, and use this metric value as a filter to randomly pick rows to display.
To create the metric to generate random values users can use the Randbetween function that is located under Functions and Operators folder in the My Shortcuts window of the Metric Editor. Users should expand the Plug-In Packages and the Randbetween function is located in the Math Functions folder.
This function requres a range from a number to a metric value as the set of values to generate. In the example shown below, 0 is the starting point and for the purpose of this example, the metric will be named 'Dummy'. Its formula is sum(1), forcing all numbers generated to be between 0 and 1, as illustrated below:
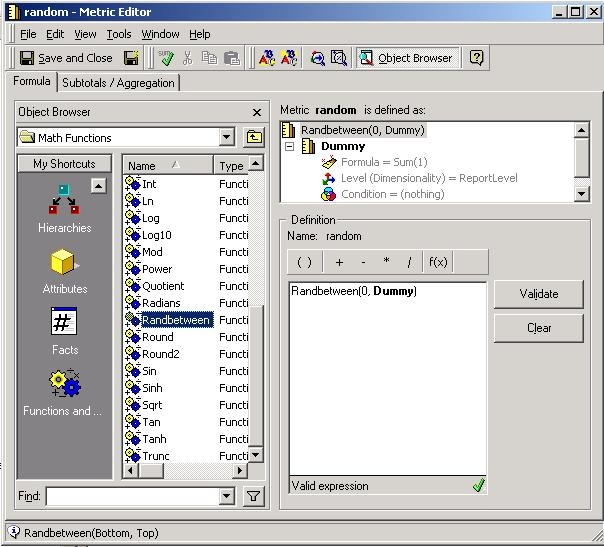
The values of the beginning and ending parameters of the Randbetween function are unimportant as long as they are different. This is because the metric will randomly generate values for each row in the report.
If the report below is re-executed, some or all of the values for the random metric will change:
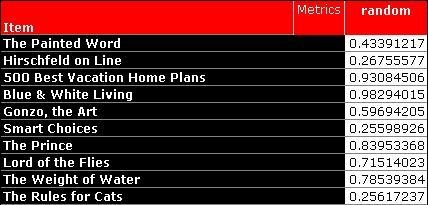
NOTE: The Randombetween function will be passed to the underlying database in SQL if the database has a supporting function. For some databases, e.g. SQL Server 2008, the RAND() function that is used does not actually return random values for each row, instead a single random value is generated and the result repeated on each row. To work around this issue, users may mark the metric as a "Smart Metric" in "Subtotals / Aggregation" tab of the metric editor. This will force the random number to be generated by the Strategy Analytical Engine instead of in the database.
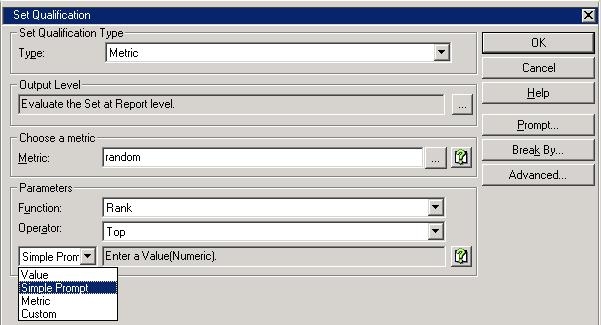
To randomly display a set of rows from the results of the dataset, users can create a filter based on the random metric. The filter will qualify on a metric and the parameters should be set to Function: Rank and Operator: Top. The Project Developer may chose to consistently display a random number of set elements, in which case the last line of the filter parameters should be set to value and the number of elements desired. For this example, since the number generated for each element by the Random Metric is randomly assigned and the Top 50 elements are selected, this will display a set of 50 random elements. This set will change every time the report is re-executed.
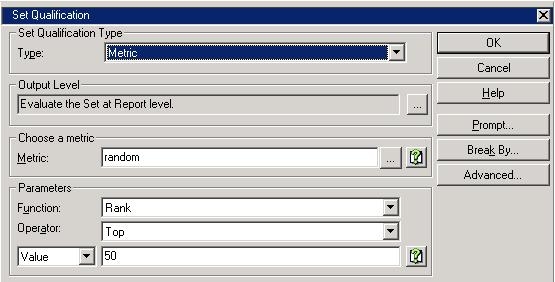
The Value parameter may also be switched to Simple Prompt so that the report will prompt an end user for the number of elements desired each time the report is executed, as shown below: