EducationSoftwareStrategy.com
StrategyCommunity

Knowledge Base

Product

Community

Knowledge Base

TopicsBrowse ArticlesDeveloper Zone

Product

Download SoftwareProduct DocumentationSecurity Hub

Education

Tutorial VideosSolution GalleryEducation courses

Community

GuidelinesGrandmastersEvents
x_social-icon_white.svglinkedin_social-icon_white.svg
Strategy logoCommunity

© Strategy Inc. All Rights Reserved.

LegalTerms of UsePrivacy Policy
  1. Home
  2. Topics
  3. Map Timeline Visualization

Map Timeline Visualization


Dong-Hyub Lee

Principal Sales Engineer • MicroStrategy


Map timeline visualization

Starting with the release of Strategy ONE (March 2024), dossiers are also known as dashboards.
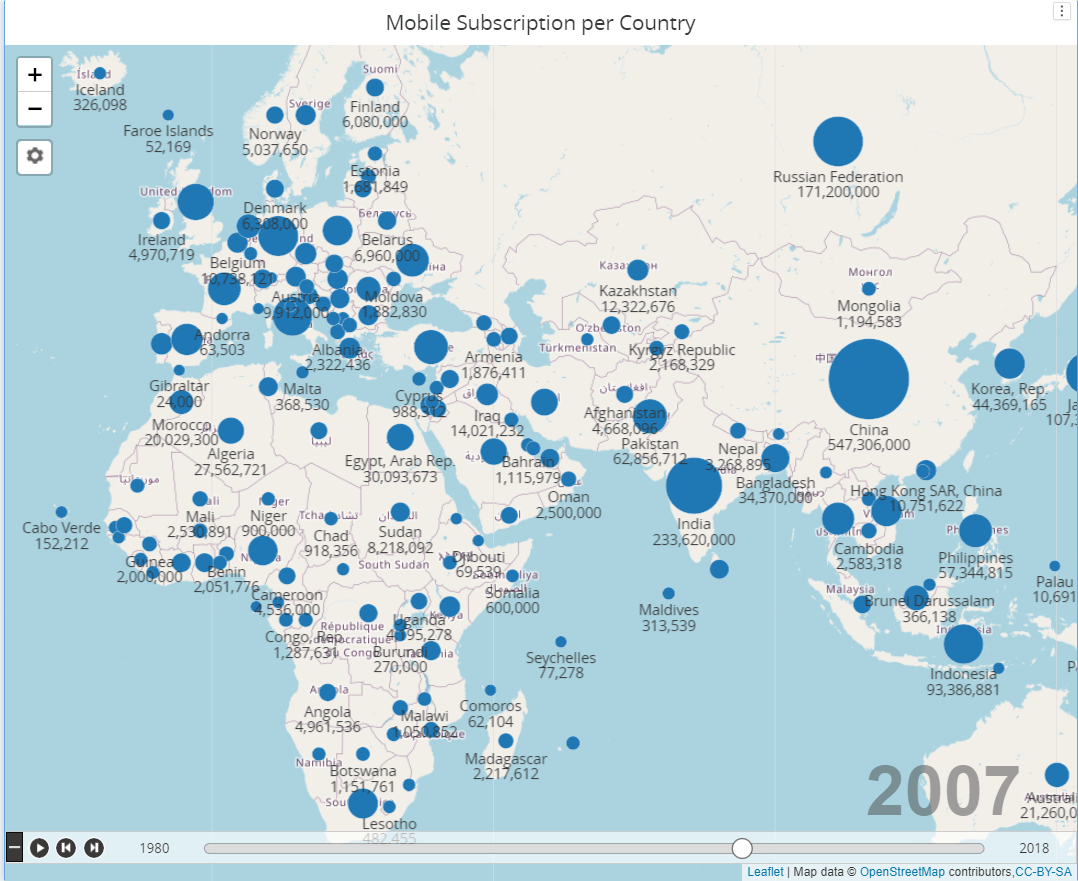
This visualization is for time line animation over map. 
It's similar to the visualization used in Covid-19 dashboard.
This visualization requires 1 attribute for Geo and timeline attribute. Latitude and Longitude are also required. It requires more than 1 metric.  
Please download MapTimeLineOSM.zip file to use. MapTimeLine.zip file is reference only and previous version of the widget used in Corona Virus dashboard of Strategy with OpenStreetMap with limited capability. 

ka0PW0000001JcZYAU_0EM2R000000fVBA.jpeg

Usage Guidance 

  • For Bubble mode, It requires latitude and longitude data. (  When you insert geojson data , it will be matched to the geo attribute. Then center of the shape is used as lat/long) 
  • For Region mode , It requires geojson data. You can input geojson data in the control button below zoom in/out buttons. 
ka0PW0000001JcZYAU_0EM2R000000fVEn.jpeg
    • After inputting geojson , Please click "Apply". You can set which property of the geojson is matched to geo attribute by selecting property in the drop-down of the top of the editor box.
    • Click Save. Geojson data will be used to visualization. 
    • If the geojson data is larger than 2 megabyte , Dossier might not save the data. To reduce geojson data or convert shape file to geojson , please refer https://mapshaper.org/ . You can reduce geojson data by using simplify feature of the Mapshaper site.  
ka0PW0000001JcZYAU_0EM2R000000fVEs.jpeg
  • For formatting color of bubble or shape, Please use metric threshold in the editor panel. If there are multiple metrics , It'll use 1st threshold of metrics.  
  • Play control can be expanded or collapsed by clicking bottom left button. 

      Configuration tab 

Visualization Configuration 

  • Shape color : Color of base map shape from geojson data. 
  • Border : Border of shape from geojson data
  • Display : Bubble or Region (Shape) 
  • Minimum and Maximum Size  : min and max radius of bubble  display mode 
  • Scale : Linear or Square method for bubble radius.   If value range of metric is too wide , Please use Square root method. 
  • Data Color : Default color of bubble or matched shape color of region mode
  • Zoom : Static - Remember current position.  Dynamic - zoom in/out depending on the data. 
  • Auto play : When visualization is displayed, It'll play automatically.
  • Update Speed  : Slow : 2 second , Medium : 1 second , Fast : 0.5 second 
  • Map color : Background color of map pane 

Installation Instructions

  • To install this visualization, download the .zip file below and deploy it in Strategy Desktop or Strategy Web. 
  • After you have installed the visualization, you can open a working demo of this visualization by downloading the .mstr file below and doing the following:
    • To open the demo visualization in Strategy Desktop, double click the .mstr file.
    • To open the demo visualization in Strategy Web, choose Create -> Upload Strategy File -> View Dashboard

Watch a quick tutorial video on importing custom visualizations in Workstation.
Strategy Version 
* Tested under version 2020
Strategy feature 
* PDF Export 
* Filter Selector is not supported.  
 
Publisher: DongHyub Lee (Sales Engineer in  Strategy Korea)  
Visualization Disclaimer
 
By downloading or using this visualization, you accept and acknowledge these terms.
This visualization is both intended as sample code and provided as a convenience to Strategy users. Strategy cannot guarantee that the code provided will apply to any Strategy releases and clients outside of the versions stated within this article. This sample is supported by Strategy Technical Support up to and including the basic visualization functionality listed in this article. Defects will be triaged by the Strategy team as they are raised. For users with active Strategy Technical Support contracts, contact Strategy Technical Support to raise these defects.


Comment

0 comments

Details

Example

Published:

May 8, 2020

Last Updated:

March 21, 2024