EducationSoftwareStrategy.com
StrategyCommunity

Knowledge Base

Product

Community

Knowledge Base

TopicsBrowse ArticlesDeveloper Zone

Product

Download SoftwareProduct DocumentationSecurity Hub

Education

Tutorial VideosSolution GalleryEducation courses

Community

GuidelinesGrandmastersEvents
x_social-icon_white.svglinkedin_social-icon_white.svg
Strategy logoCommunity

© Strategy Inc. All Rights Reserved.

LegalTerms of UsePrivacy Policy
  1. Home
  2. Topics

MicroLearning: Combine Columns into a Multiform Attribute


Stefan Zepeda

Salesforce Solutions Architect • Strategy


If you have separate columns of closely related data (like customer first name, last name, phone number, and address), combine the columns so MicroStrategy can provide helpful display options.

How to Use Images as Thresholds in Google Maps

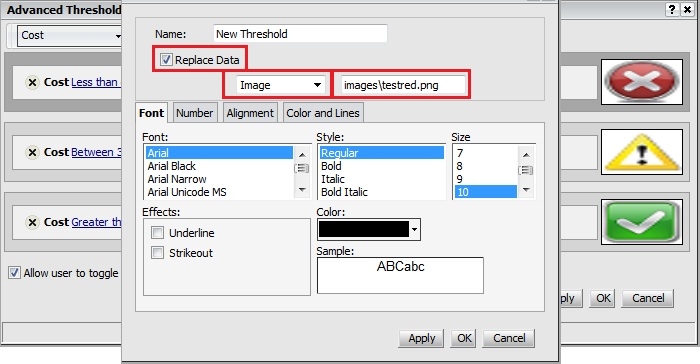
In Strategy Web 9.x, images can be used as thresholds for the Google Map widget, as shown below.
 

ka02R000000g4t9QAA_0EM44000000279V.jpeg


  • Find a set of images that are color coded to represent the thresholds. Place the images inside the images folder of the Strategy Web Server.


    Sample Code/Error

    <Web Home>\images


  • Apply a threshold to the metric being used in the grid that renders the Google Map.
ka02R000000g4t9QAA_0EM44000000279X.jpeg
  • This can be achieved by going into the threshold editor. Enable Replace Data and select Image from the drop-down.
  • Reference the images using a relative path like below:
ka02R000000g4t9QAA_0EM44000000279S.jpeg
  • Sample Code/Error

    images\imagename.png


  • In the widget editor, select Use Image Markers for Marker Style / mode and enable Apply threshold for the map.
ka02R000000g4t9QAA_0EM44000000279F.jpeg
  • Save and run.


How to Use Images as Thresholds in ESRI Maps


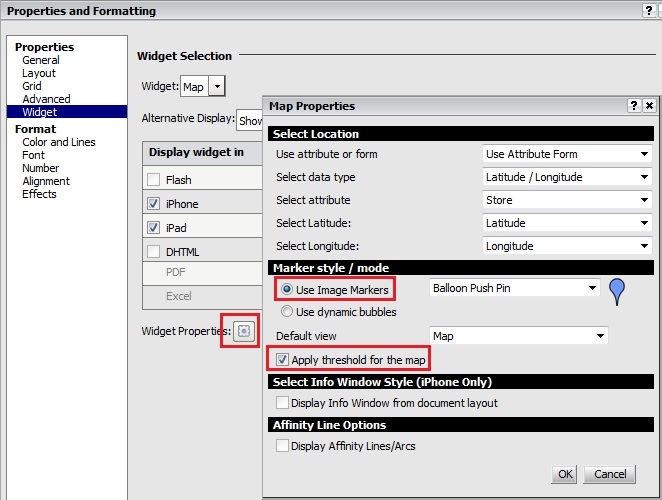
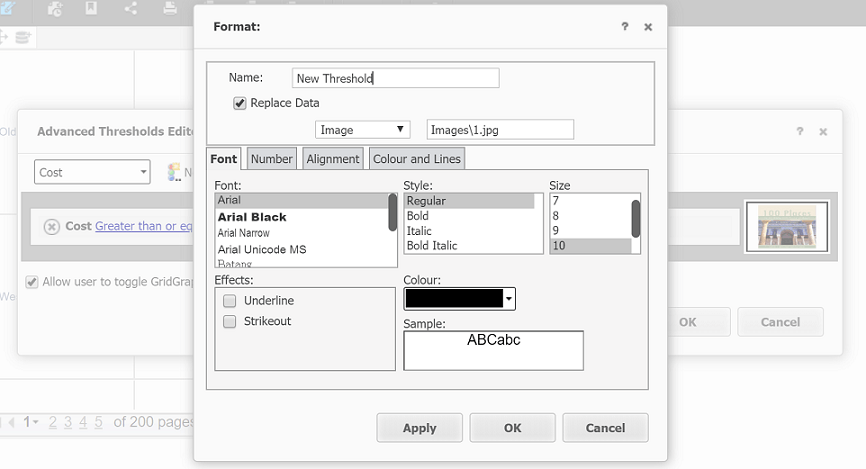
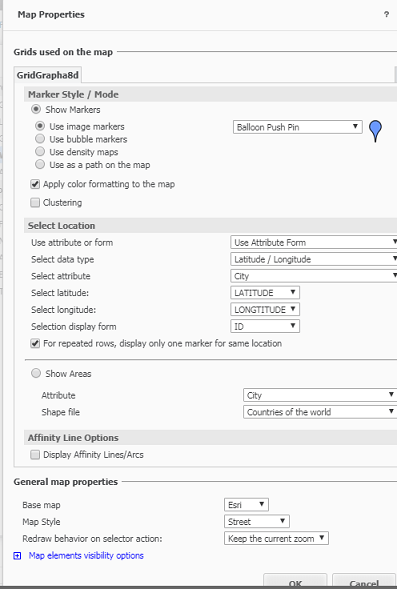
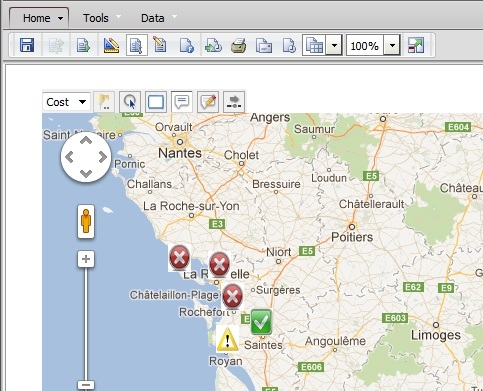
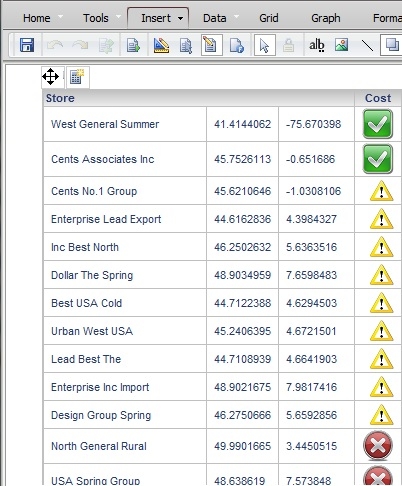
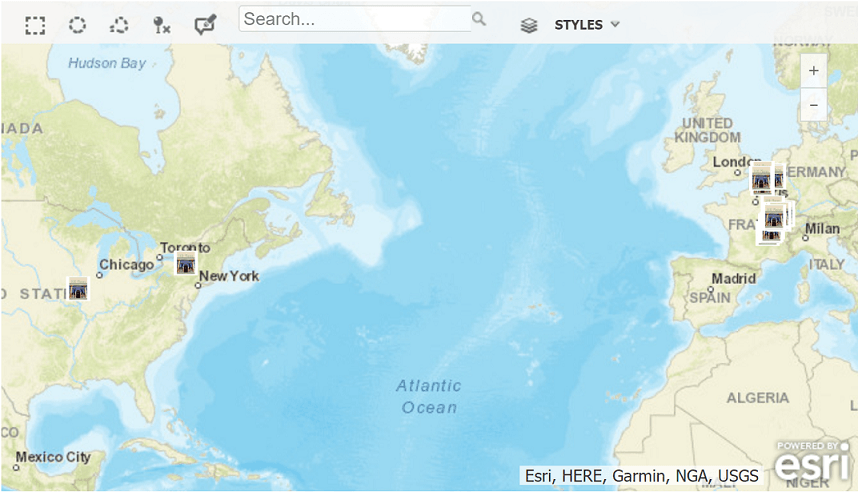
In Strategy 2019, you can now use images as thresholds in Google maps and ESRI maps.

ka02R000000g4t9QAA_0EM2R000000mwOb.jpeg
  • Find a set of images that are color coded to represent the thresholds. Place the images inside the images folder of the Strategy Web Server.

    Sample Code/Error

    <Web Home>\images

     
  • Apply a threshold to the metric being used in the grid that renders the map. Enable Replace Data and select Image from the drop-down. Reference the images using a relative path, like below.

    Sample Code/Error

    images\imagename.png


ka02R000000g4t9QAA_0EM2R000000mwPj.jpeg
  • In Map Properties, select Apply color formatting to the map.
ka02R000000g4t9QAA_0EM2R000000mwQD.jpeg
  • Save and Run.


Comment

0 comments

Details

Knowledge Article

Published:

June 12, 2017

Last Updated:

June 12, 2017