EducationSoftwareStrategy.com
StrategyCommunity

Knowledge Base

Product

Community

Knowledge Base

TopicsBrowse ArticlesDeveloper Zone

Product

Download SoftwareProduct DocumentationSecurity Hub

Education

Tutorial VideosSolution GalleryEducation courses

Community

GuidelinesGrandmastersEvents
x_social-icon_white.svglinkedin_social-icon_white.svg
Strategy logoCommunity

© Strategy Inc. All Rights Reserved.

LegalTerms of UsePrivacy Policy
  1. Home
  2. Topics

KB483466: MicroStrategy 2019 Update 2: Improved Platform Analytics Health Check


Frederick Kellerman

Cloud Support Expert I • MicroStrategy


This article discusses a new feature in MicroStrategy 2019 Update 2 that improves upon the existing Platform Analytics health check. As part of this feature, there is a new tool that allows administrators to manually perform health checks on Platform Analytics.

Prior to Strategy 2019 Update 2, health checks were automatically performed on Platform Analytics installations when Platform Analytics Consumer was started. This health check analyzed the status of the Platform Analytics MySQL Warehouse, Redis Server, and Kafka Cluster.
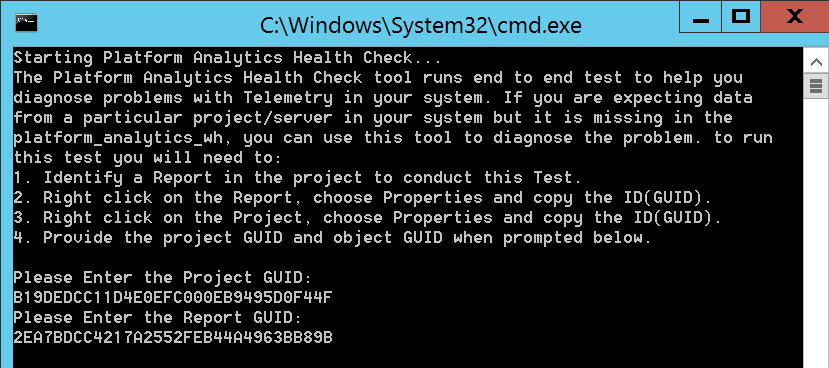
Starting in Strategy 2019 Update 2, an additional tool allows administrators to manually perform health checks without restarting Platform Analytics. This new tool includes the original checks listed above, as well as checks to test the Intelligence Server object telemetry and Platform Analytics statistics logging. Usage is as follows:

  1. Browse to the bin folder of the Platform Analytics installation. On Windows, navigate to C:\Program Files (x86)\Strategy\Platform Analytics\bin. On Linux, navigate to /opt/MicroStrategy/PlatformAnalytics/bin (default).
  2. From this location run the platform-analytics-health-check.(sh/bat) utility. On Windows, users should browse to this location through cmd and run the batch file through cmd. If you launch the batch file by double-clicking on it, it will silently close after completing the health check.
  3. You are prompted to enter a Project GUID and Report GUID. The project and report are used as a reference point to confirm that objects from the metadata properly load into the Platform Analytics warehouse lookup tables.
ka02R000000g0WzQAI_0EM2R000000lIrH.jpeg
  1. You are prompted to modify the report description entered in step three and then run the report. This test confirms that PA statistics are logged and object information is loaded to the PA warehouse. You can modify the report description by browsing to the report in Developer, right-clicking it, choosing Properties, and adding text to the Description window.
  2. Execute the report. A health check is performed. The results of the health check are written to the console. Full results are written to the log noted in the output. The default location of this file is within the log folder, inside the bin folder. Example: C:\Program Files (x86)\Strategy\Platform Analytics\bin\log.
ka02R000000g0WzQAI_0EM2R000000lIrC.jpeg

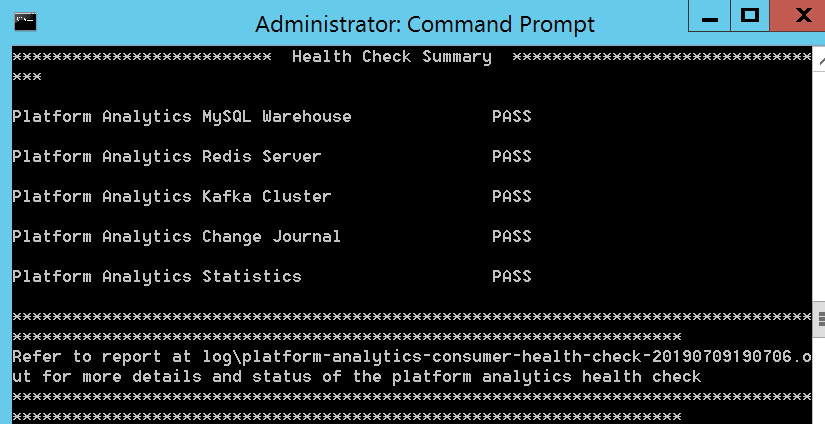
If issues are encountered during the health check, the health check log suggests corrective actions:


07/08/2019 16:27:31.879 INFO Change Journal Health Check Consumer configured to consume from last offset
07/08/2019 16:27:43.661 INFO Starting Intelligence Server Change Journal Producer Test
07/08/2019 16:32:43.717 ERROR Change Journal log for Object with GUID: 2840589948B7F9B817CBB18BC32F91E2 in project GUID B19DEDCC11D4E0EFC000EB9495D0F44F not found in kafka topic.
Change Journal Producer Test status: Fail
07/08/2019 16:32:43.717 ERROR Please follow the steps below to verify that the Intelligence Server is correctly configured to write the telemetry to Kafka:
1. Connect to your Intelligence Server though Command Manager.
2. Run the command:
   'LIST ALL FEATURE FLAGS;'
3. In the results verify that feature flag with the name 'Messaging Service for Platform Analytics' is 'ON'.
4. If it is 'OFF', run the below command to turn it 'ON'
   'ALTER FEATURE FLAG "Messaging Service for Platform Analytics" ON;'
5. Next Run the command:
   'LIST PROPERTIES FOR SERVER CONFIGURATION;'
6. In the result verify that property 'Telemetry Server enabled' is set to True.
If it is set to False. Execute the below command to enable this property:
'ALTER SERVER CONFIGURATION ENABLEMESSAGINGSERVICES TRUE CONFIGUREMESSAGINGSERVICES "bootstrap.servers: tec-l-002429.labs.Strategy.com:9092,tec-l-001614.labs.Strategy.com:9092,tec-l-001613.labs.Strategy.com:9092/batch.num.messages:5000/queue.buffering.max.ms:2000";
7. If the 'Telemetry Server enabled' property is already set to True. Restart your Intelligence Server for it to be effective
07/08/2019 16:32:43.717 INFO Change Journal End-to-End Test health check result is unhealthy.


Comment

0 comments

Details

Knowledge Article

Published:

July 10, 2019

Last Updated:

July 10, 2019