EducationSoftwareStrategy.com
StrategyCommunity

Knowledge Base

Product

Community

Knowledge Base

TopicsBrowse ArticlesDeveloper Zone

Product

Download SoftwareProduct DocumentationSecurity Hub

Education

Tutorial VideosSolution GalleryEducation courses

Community

GuidelinesGrandmastersEvents
x_social-icon_white.svglinkedin_social-icon_white.svg
Strategy logoCommunity

© Strategy Inc. All Rights Reserved.

LegalTerms of UsePrivacy Policy
  1. Home
  2. Topics

KB485994: "More options" on each Dossier Visualization


Witold Przegalinski

Principal Consultant • MicroStrategy


This article outlines the "More Options" dialog box where you can select additional formatting, calculation and attribute/metric join options for a visualization.

Starting with the release of Strategy ONE (March 2024), dossiers are also known as dashboards.
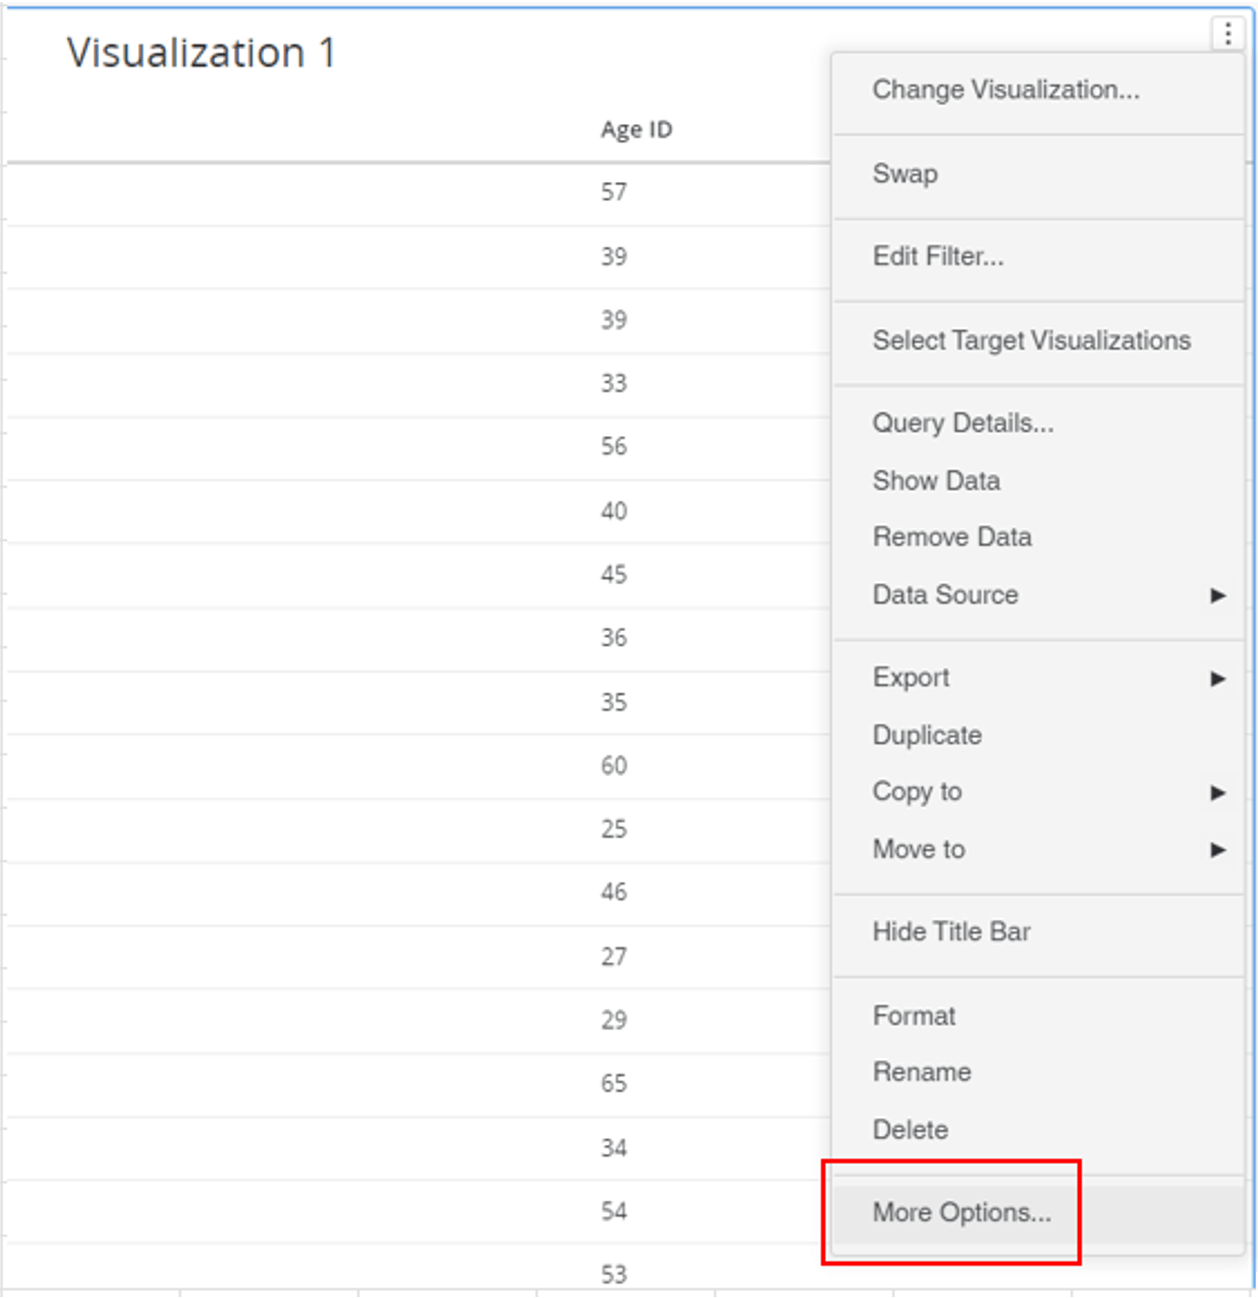
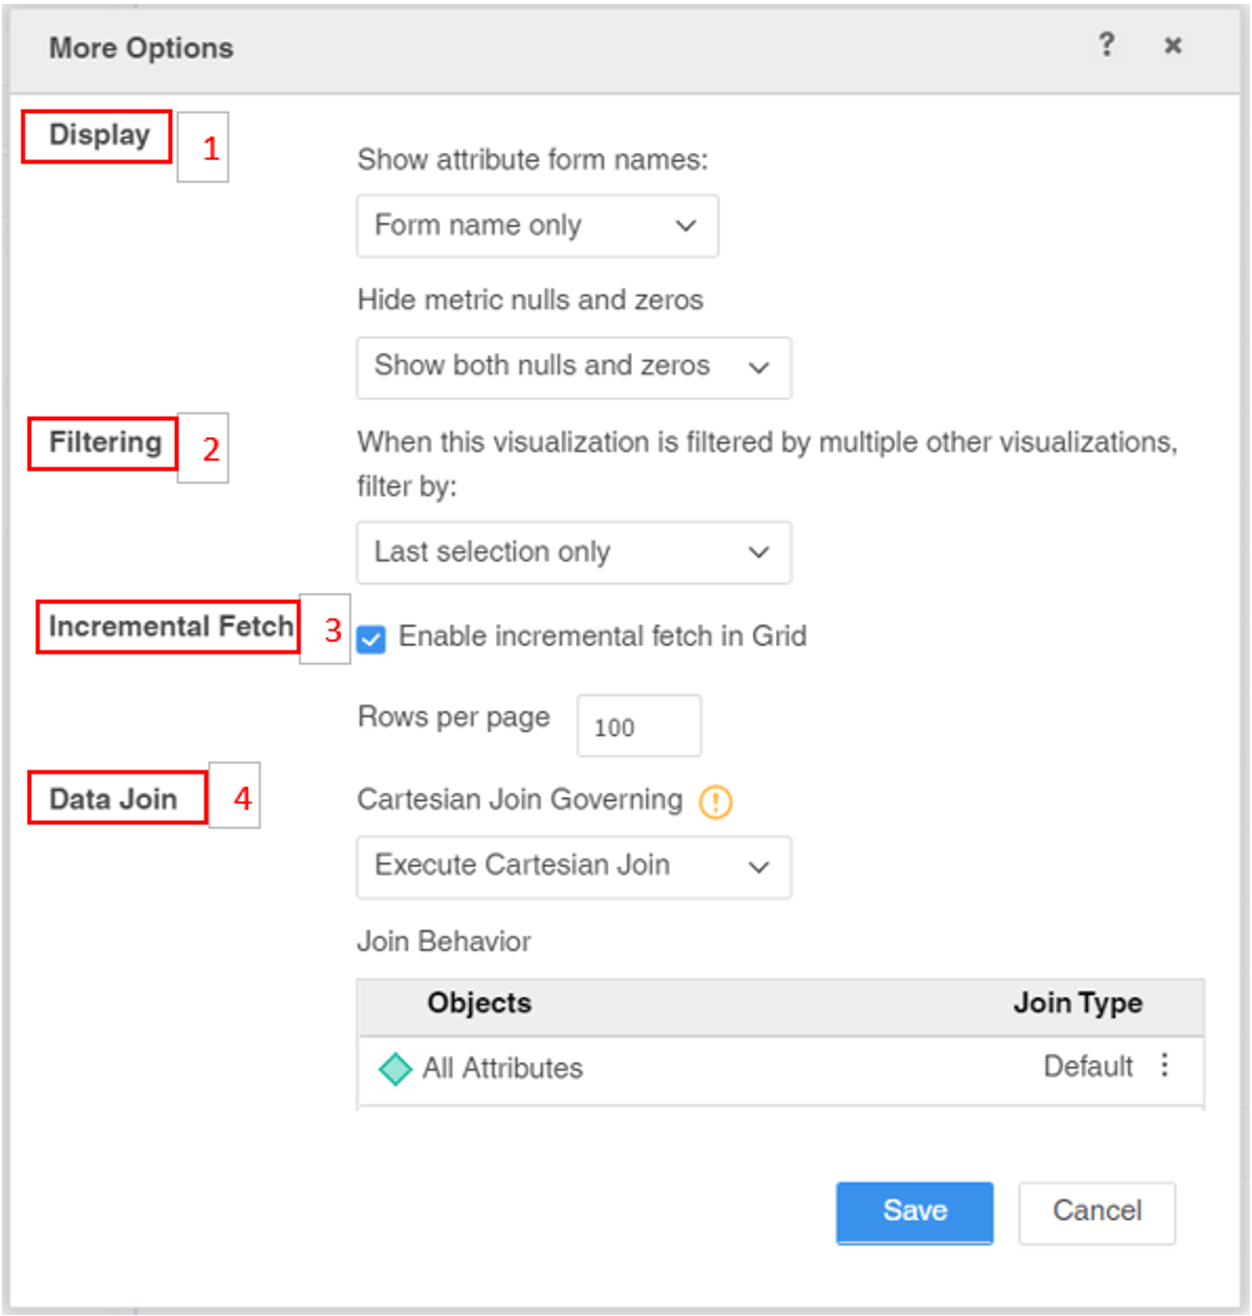
Whenever you click on the three dots in the upper right corner of each visualization on the dossier you will have the Settings window open. At the bottom of the Settings window, you will see the “More Options” option available. After clicking you will see the following actions you can perform on your visualization:

  • Display
  • Filtering
  • Incremental Fetch
  • Data Join
ka0PW0000001JkqYAE_0EM4W0000071CBz.jpeg
ka0PW0000001JkqYAE_0EM4W0000071CC9.jpeg


Display

Show attribute form names:

  • Off - No attribute form name will appear for the attribute.
  • On - All attribute forms will be displayed that were set to be displayed for the attribute. 
  • Form name only - If your visualization is a grid, you can automatically display a single header for each selected attribute form.
  • Show attribute once - If your visualization is a grid, you can display a header for each attribute form and include the attribute name only in the header for the first attribute form for each attribute. 
  • Automatic - If your visualization is a grid, you can display either headers for each attribute or attribute form, depending on the number of attribute forms visible in the grid for each attribute.

Hide metric nulls and zeros: 

  • Show both nulls and zeros - to show all zeros and nulls on grid/visualization. 
  • Hide both nulls and zeros - to hide all zeros and nulls on grid/visualization.
  • Hide nulls only - to hide all null values on grid/visualization.
  • Hide zeros only - to hide all zero values on grid/visualization.

Filtering

When this visualization is filtered by multiple other visualizations, filter by: 

  • Last selection only - only elements from last selection of many will be displayed.    
  • Intersection of all selections - all elements from multiple selections will be displayed as a result. 


Incremental Fetch

  • Enable incremental fetch in Grid - Incremental fetch divides large documents or layouts into pages, thereby loading the data in batches (or blocks) rather than all at the same time. This improves the usability and performance of a large document or layout, by reducing the load and overall memory usage on the web server.
  • Rows per page - option to set the number of rows to be displayed on each page. 

Data Join

Cartesian Join Governing: 

  • Use inherited value - Use join type set already on metrics in the visualization. 
  • Cancel execution - Whenever a cross join is part of SQL execution the running of dossier is cancelled. 
  • Execute Cartesian Join - Execute dossier with a cross join in data. 

Join Behavior

For attributes: 

  • Inner Join - Displays only the attribute elements common to all data warehouse tables from which data is being gathered for this attribute
  • Outer Join, ignore filter - Displays all the attribute elements from all data warehouse tables from which data is being gathered for this attribute and ignores any filtering applied on the attributes. 
  • Outer Join, preserve filter - Displays all of the attribute elements from all data warehouse tables from which data is being gathered for this attribute and preserves any filter applied on the attributes. 

For metrics:

  • Default - Join behavior as set on metric level.
  • Inner Join - includes only data that is common to all components of the join.
  • Outer Join - includes data that applies to all components of the visualization. 


Comment

0 comments

Details

Knowledge Article

Published:

April 12, 2023

Last Updated:

March 21, 2024