Starting with the release of Strategy ONE (March 2024), dossiers are also known as dashboards.
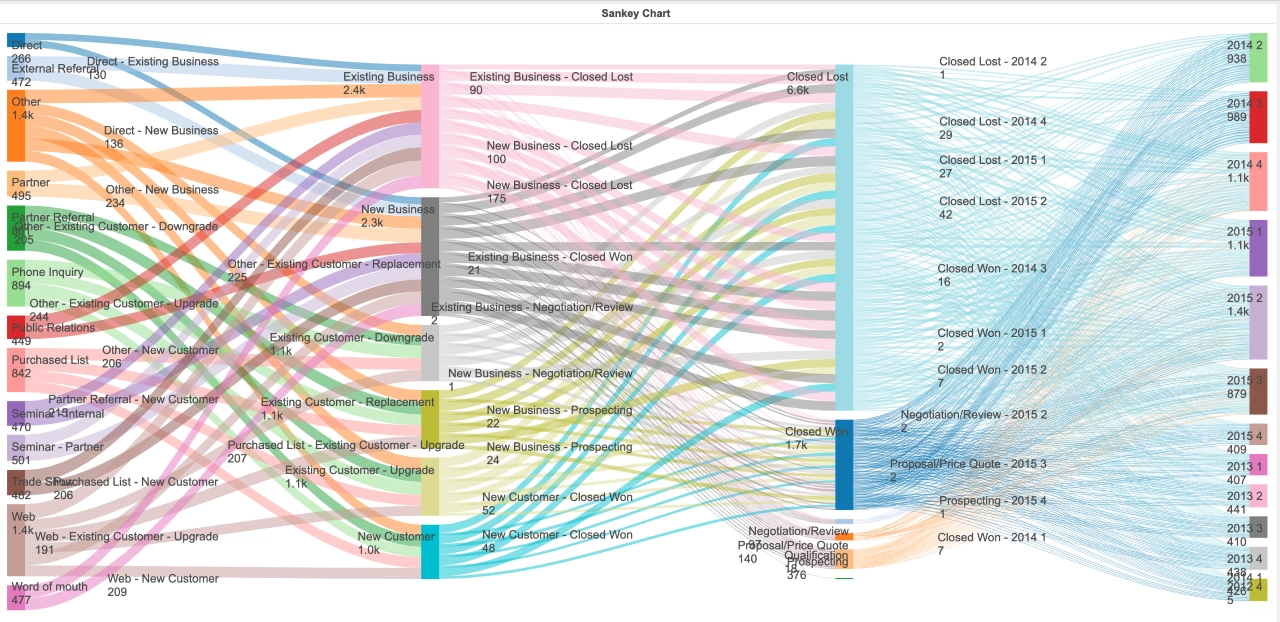
A Sankey diagram is a visualization used to depict a flow from one set of values to another. The things being connected are called nodes and the connections are called links. You can create a Sankey chart with multiple levels of connections. Multi-level Sankey charts will add additional levels as needed, laying them out automatically using Vitaracharts for Strategy.
Additionally, flexibility is provided to display data labels at nodes or links.
Requirements
Attributes -2
Metrics -1
Strategy version 10.4 or higher.
Strategy Features
Vitaracharts is now FREE for Desktop and Workstation.
Please contact sales@vitaracharts.com to get a 30-day trial key.
Take note that this visual is a part of the VitaraCharts library.
Download visualizations: www.vitaracharts.com
Online interactive visualizations can be accessed here: https://cloud.vitaracharts.com
Publisher: Vitara
Vitara is a Strategy technology partner and offers a fully supported, production-ready chart plugin (VitaraCharts) with 30+ stunning visualizations to enhance Strategy analytics. All Vitara visualizations are customizable and supported through upgrades for a hassle-free experience. We perform extensive testing for backward compatibility with all currently certified versions of Strategy and also ensure all new versions of Strategy are tested and supported across all charts.
For more details please contact sales@vitaracharts.com or www.vitaracharts.com.