Starting with the release of Strategy ONE (March 2024), dossiers are also known as dashboards.
New Features & Functionality
NBA Playoff Stats Dossier
The 2018-19 NBA season tips off tonight, Tuesday October 16th. Check out this dossier to explore statistics from the past three NBA seasons' playoffs.
Here's the schedule for the first game for each team.
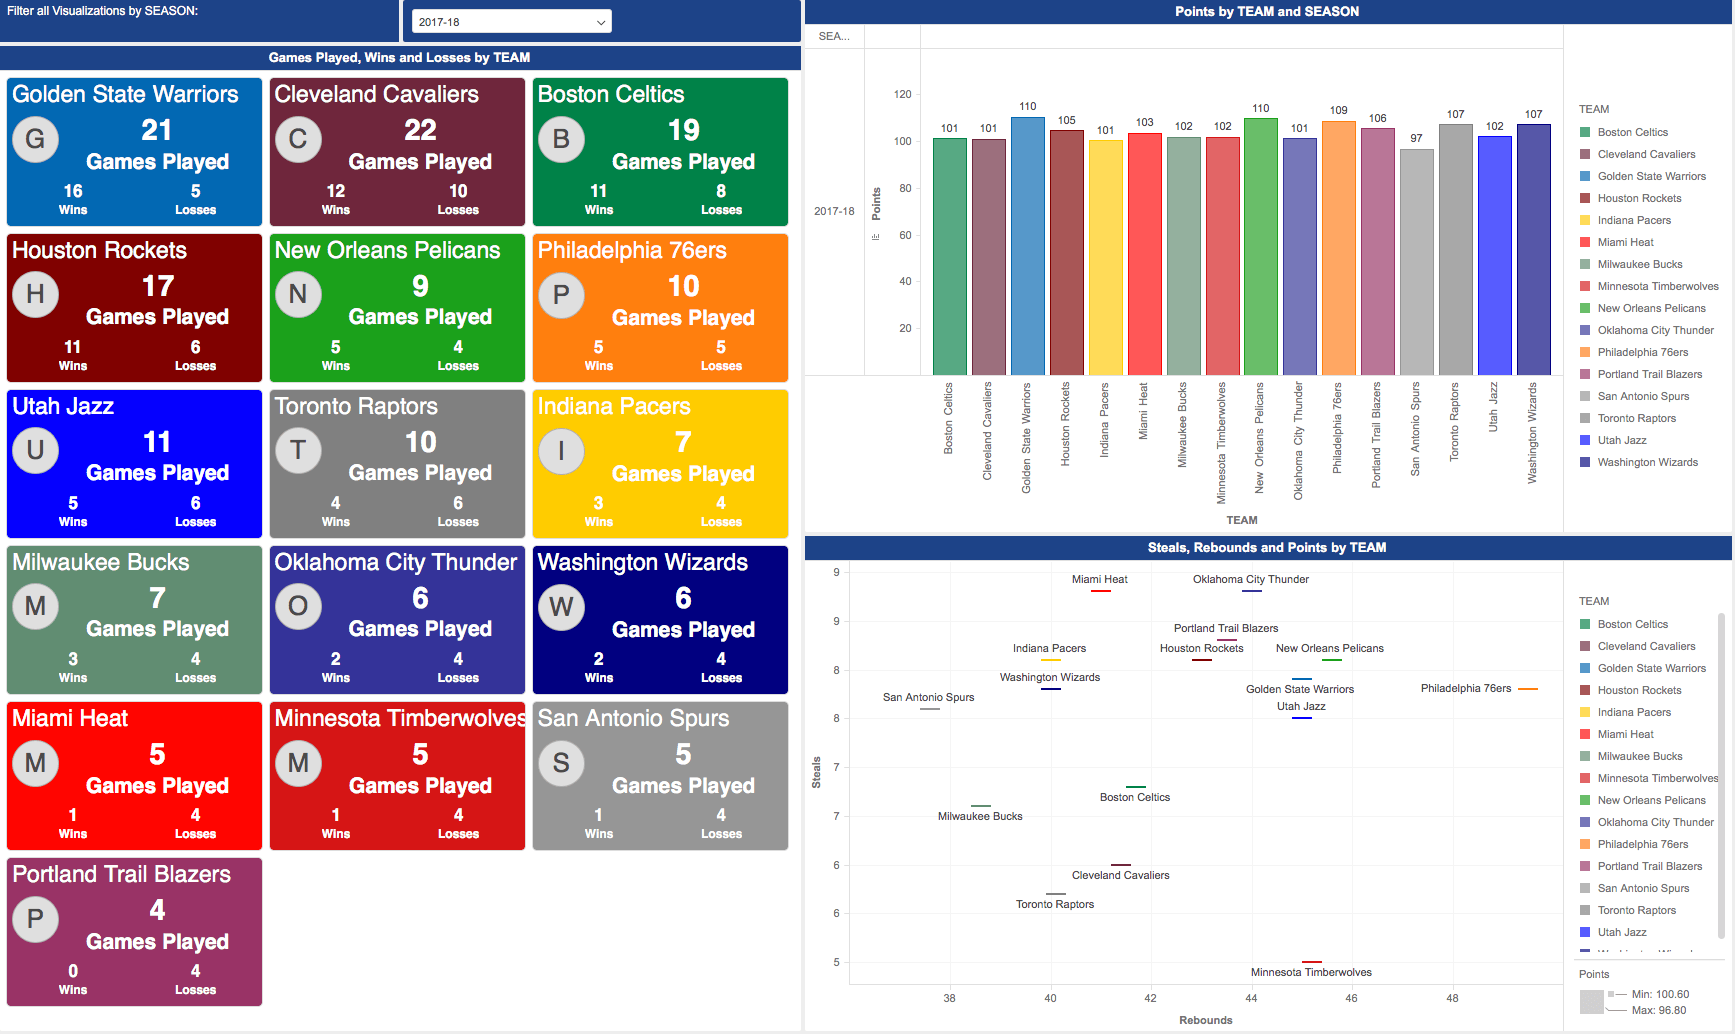
The Card Widget visualization shows you the wins/losses by team, and you can filter by season. Last season, the Golden State Warriors had the most wins, with 16 wins and 5 losses. While the Portland Trail Blazers had 0 wins and lost all 4 games they played.
The bar chart shows points by team and in the 2017-18 season you can see an average of about 105 points per game.
You'll need to download the Card Widget plug-in to view the above visualization. Check out this Community post to download.
Watch this short video to learn how to import a custom visualization!
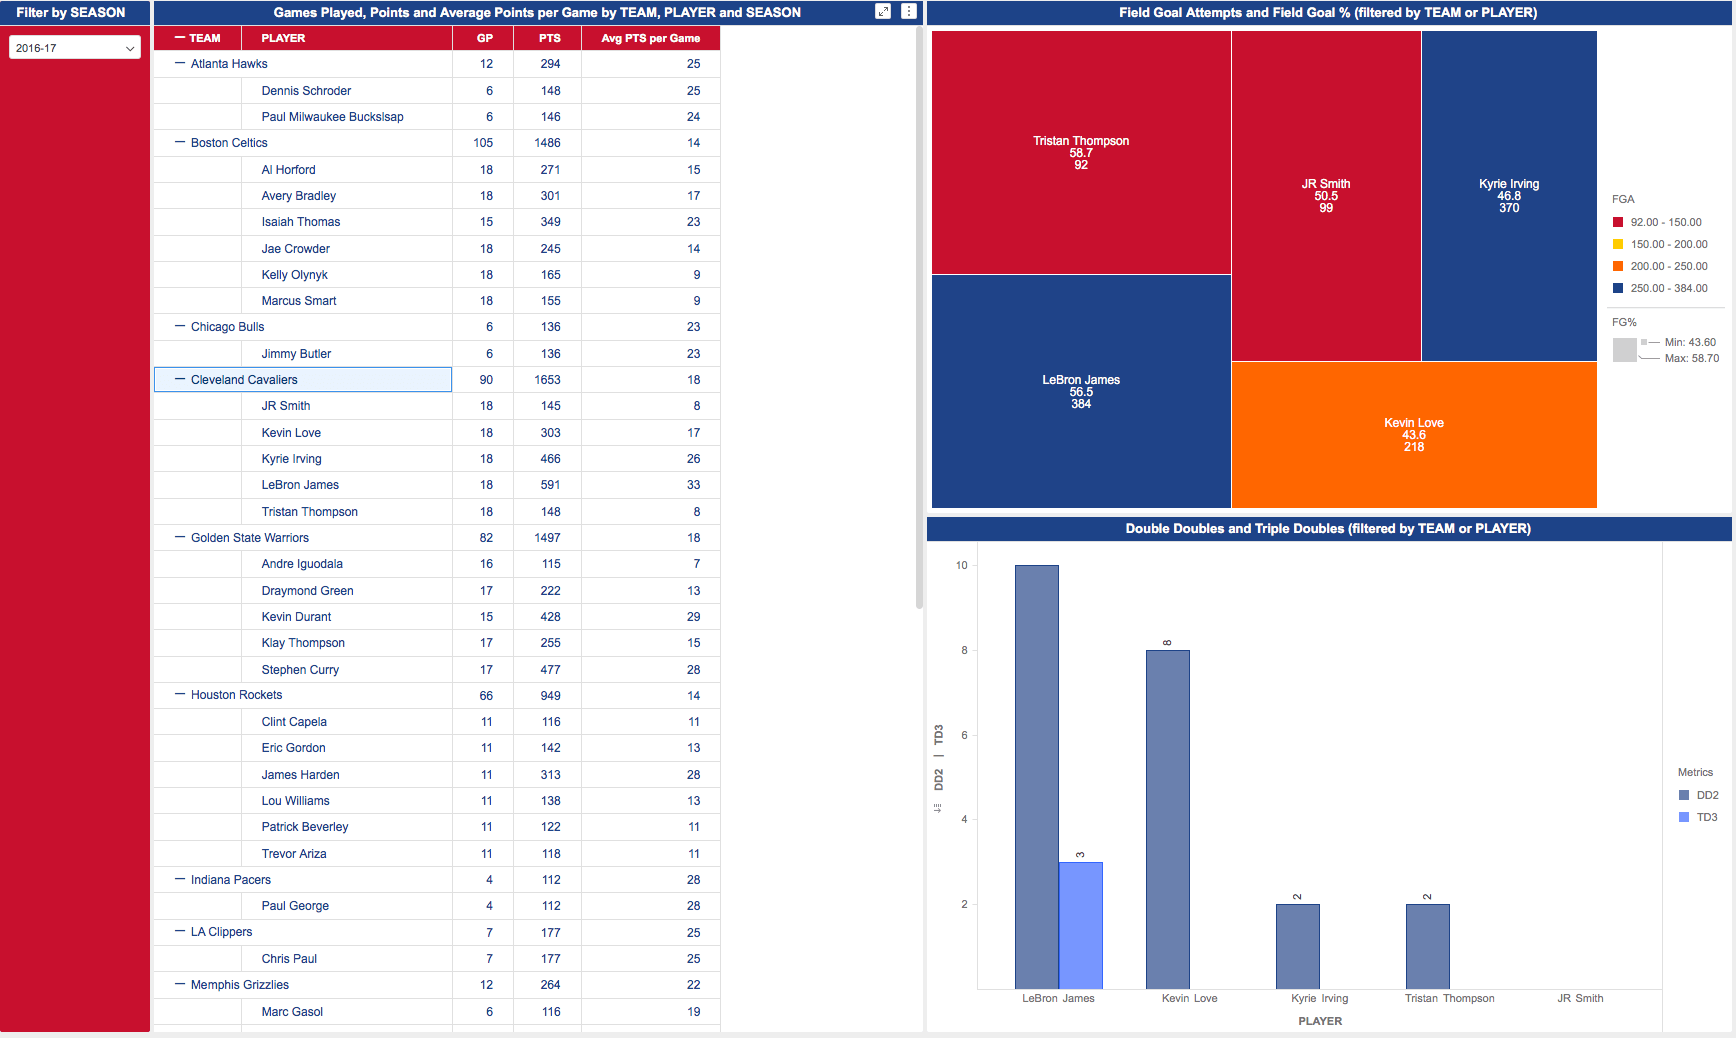
Click on the team name in the outline mode grid to filter the heat map and bar chart. Here we can see the Cleveland Cavaliers selected, so the heap maps shows us the field goal attempts and field goal percentages for their players. Tristan Thompson had the highest field goal percentage at 58.7%, but had only 92 field goal attempts compared to LeBron's 384 attempts and a FG% of 56.5%. Download the mstr file to check out the other teams' stats.
The bar chart shows that LeBron James had 10 double doubles and 3 triple doubles.
When a player reaches double figures (10 or more) in two of the five main statistical categories – points, rebounds, assists, steals and blocks – they have achieved a double-double.
When a player reaches double figures in three of the five categories, they have achieved a triple-double. Nearly all triple-doubles consists of points, rebounds and assists.
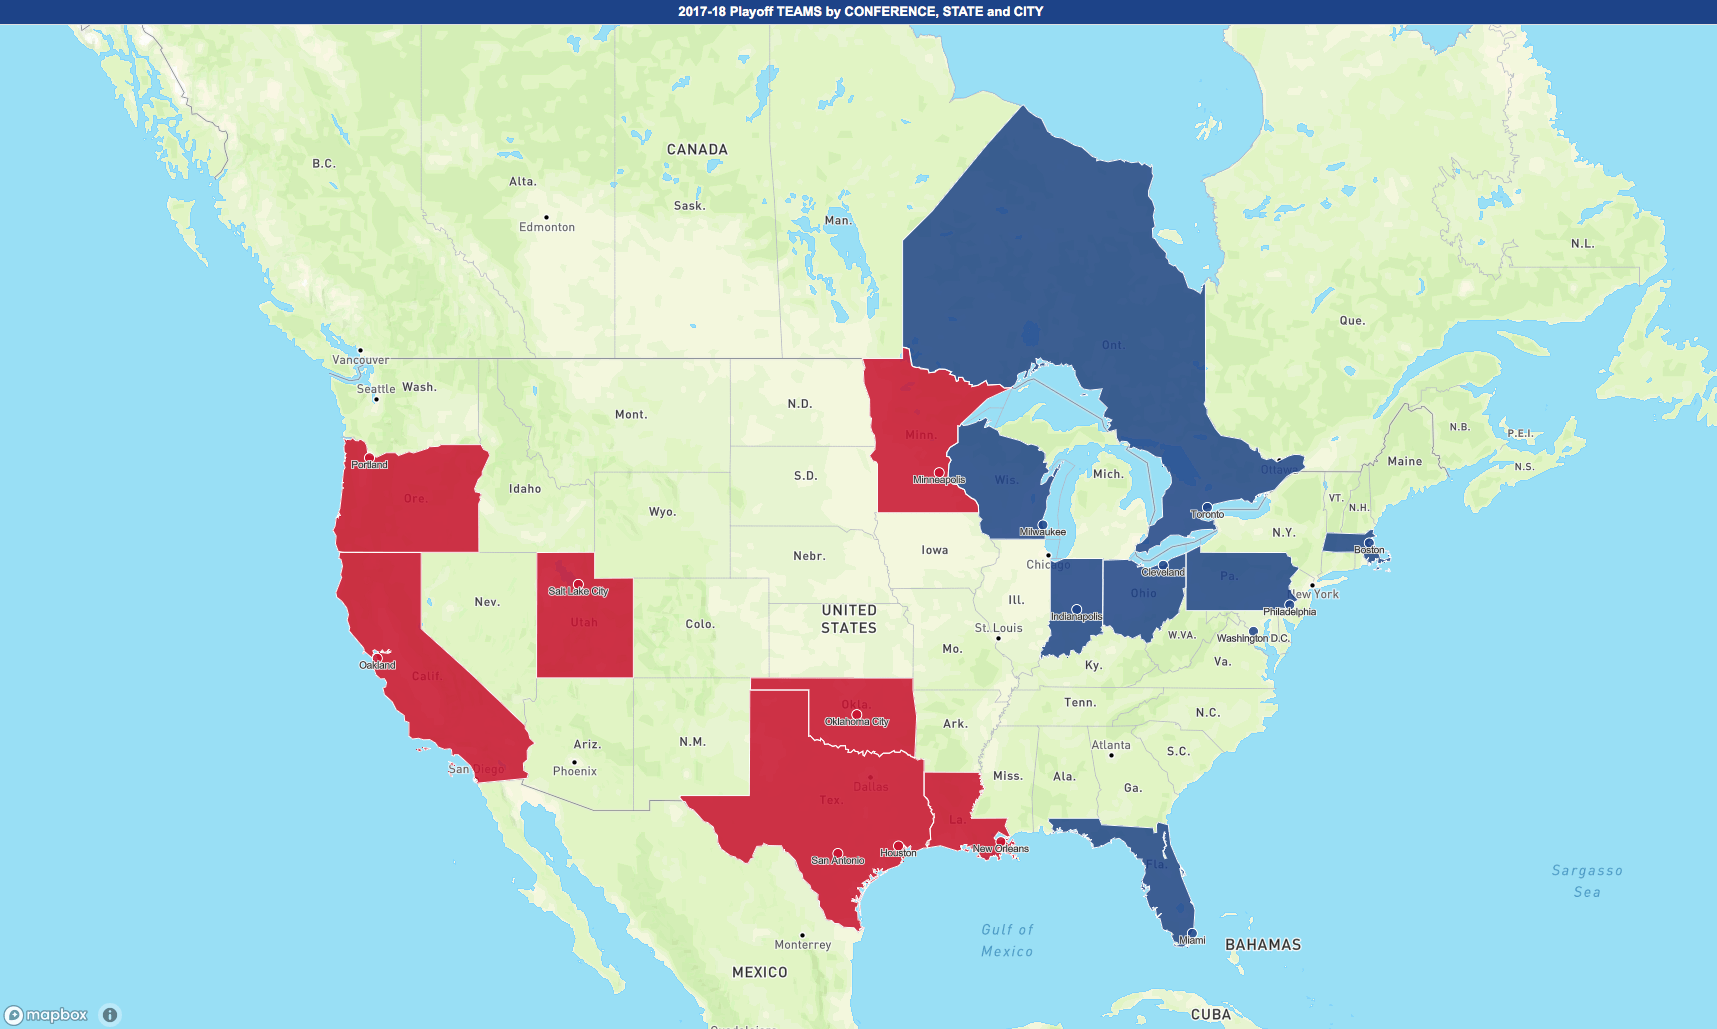
This map shows the 2017-8 playoff teams by conference.
Download the dossier to check out the other visualizations and interact with the data. Feel free to share your feedback below!
Make your own dossier with this season's NBA stats with MicroStrategy Desktop!