User Input Contains | Sample Query Pattern | Sample Question | Widget Used | Visualization and Insights |
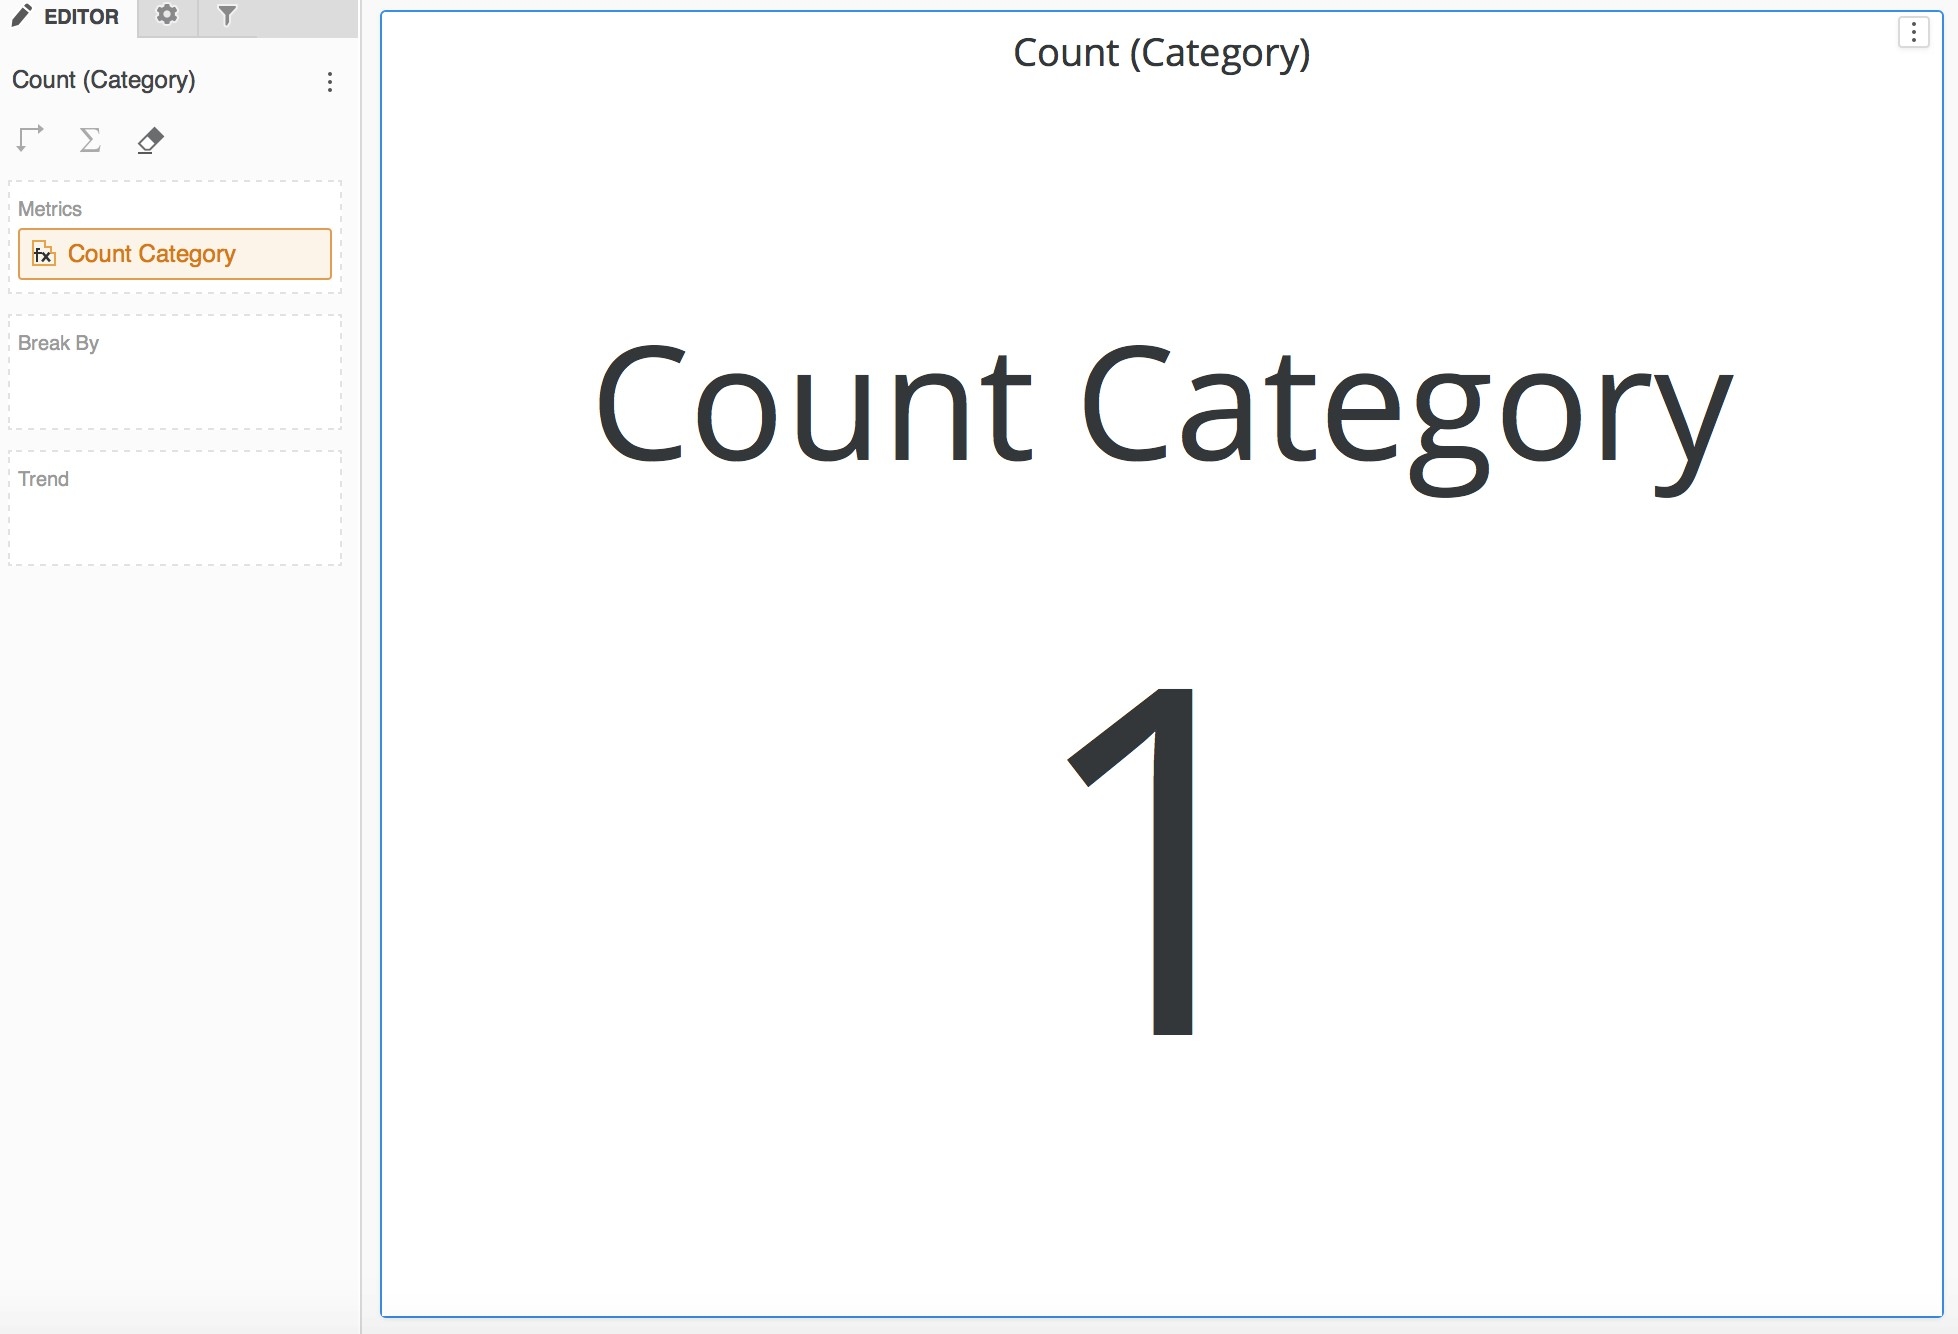
Only 1 Metric | What is the [metric] | What is the Number of Flights? | KPI | |
1 Metric + 1 Time Attribute + 0~N Attributes | What is the [metric] by "time attribute" | Please show Profit by Month. | Line Graph | |
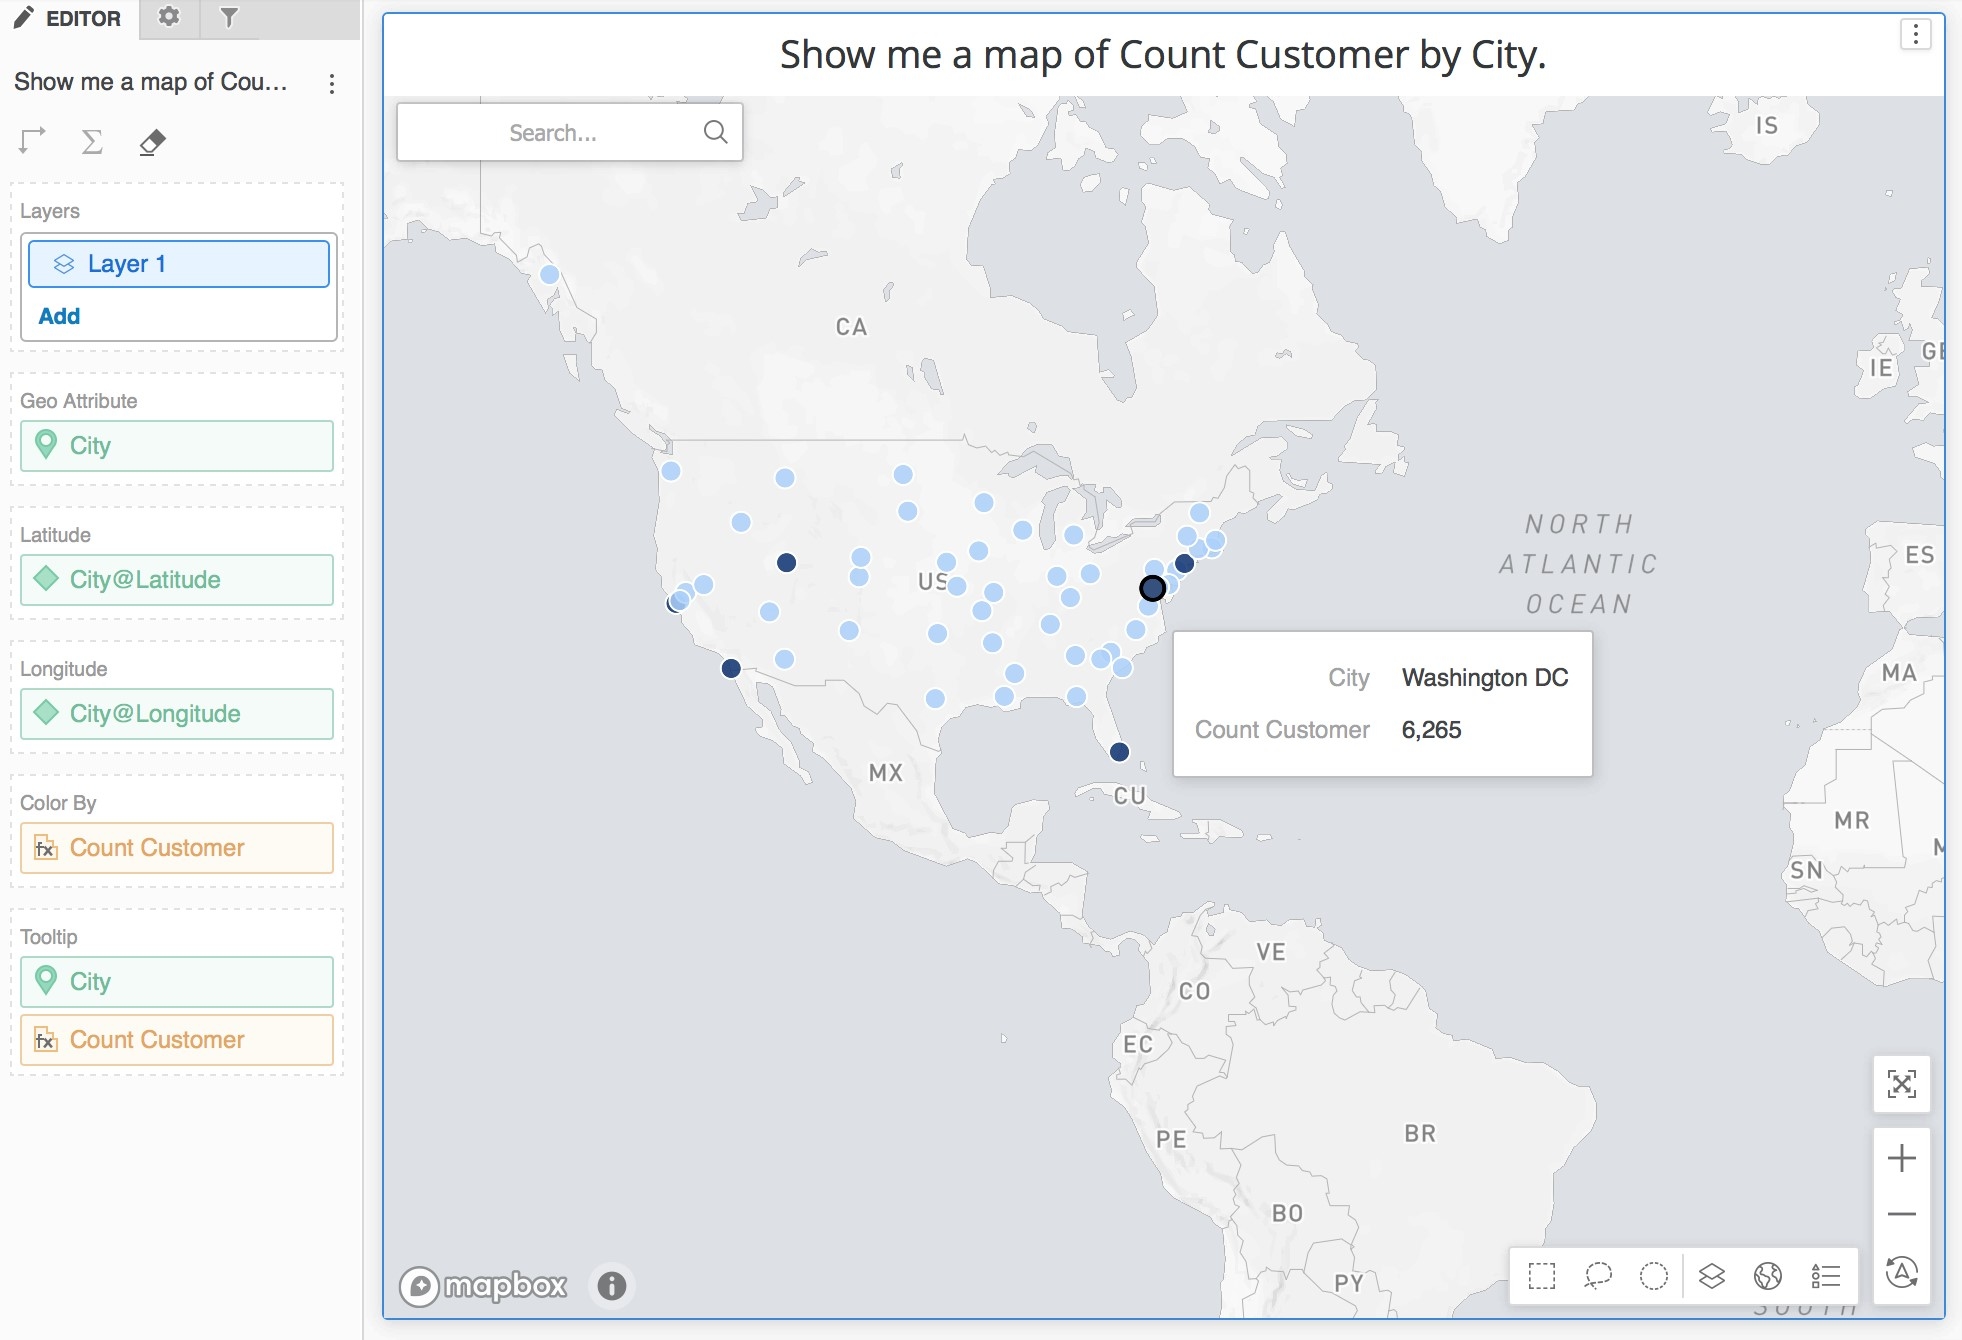
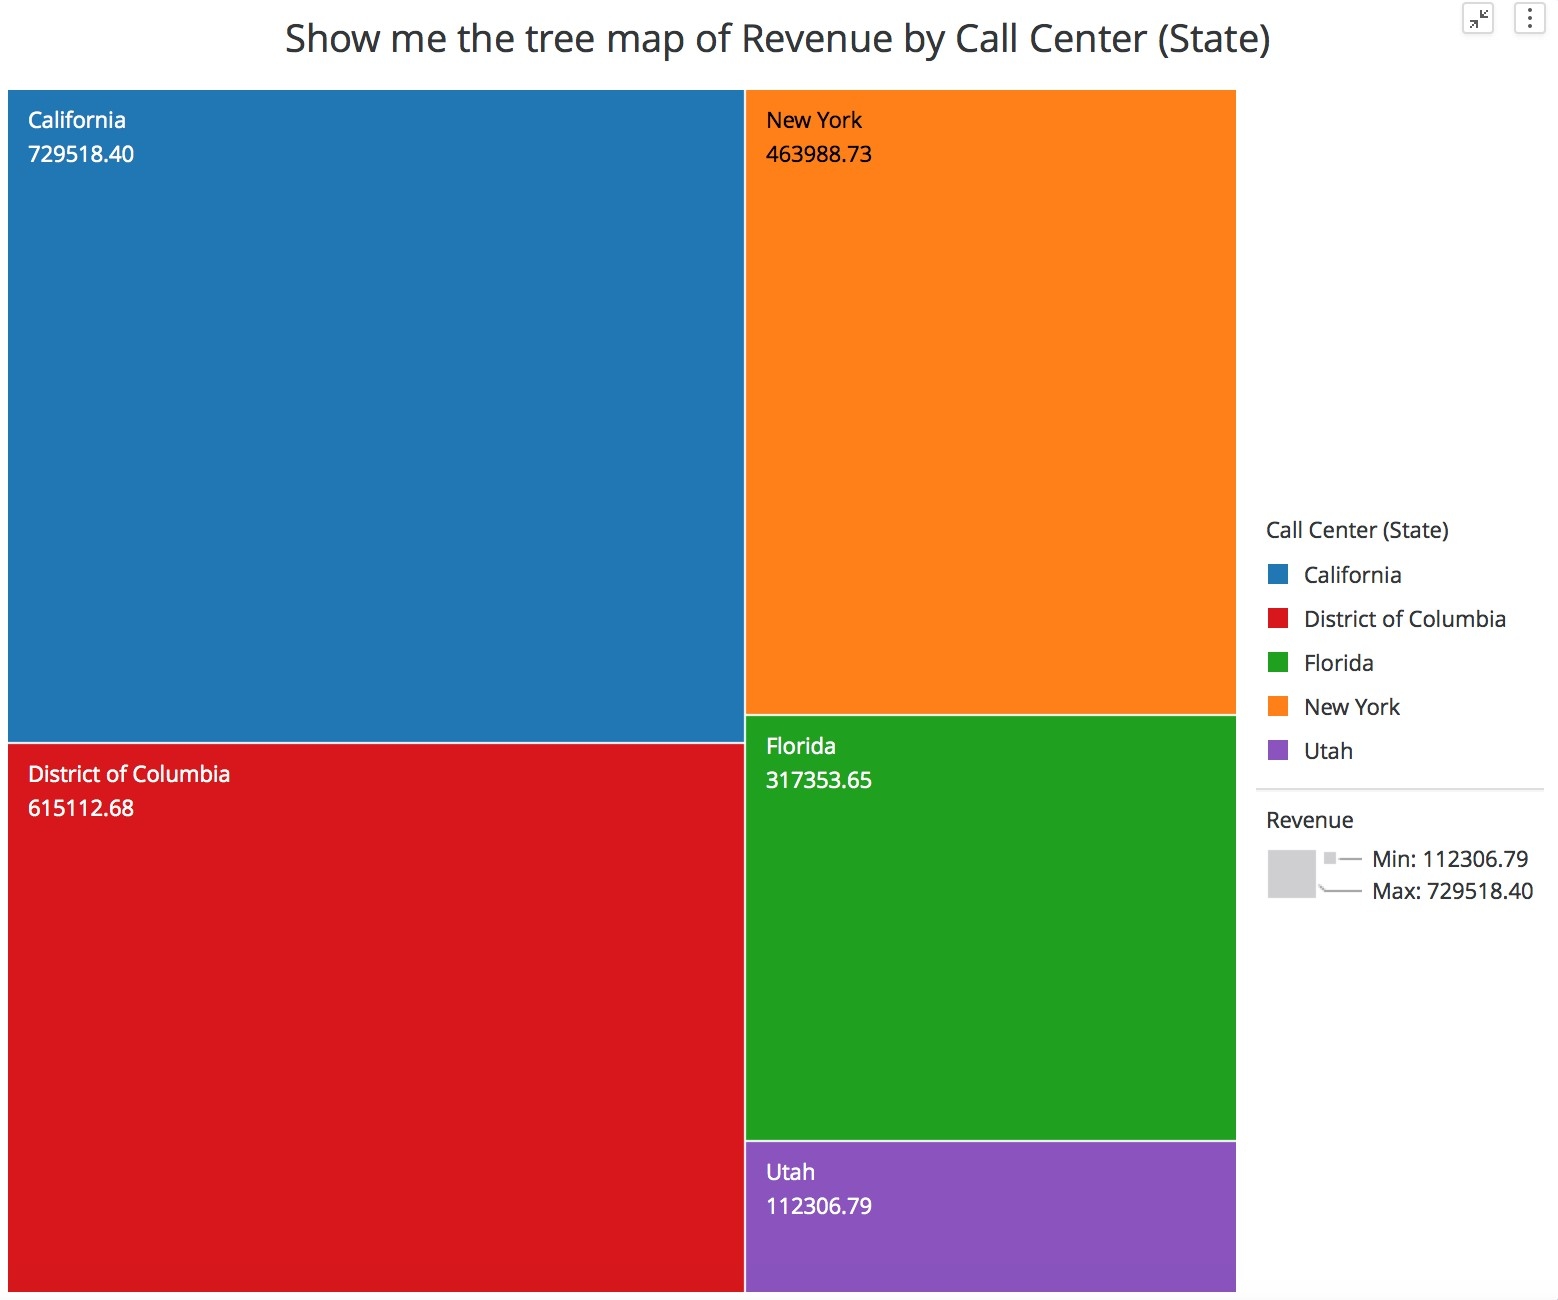
1 Metric + 1 Geo Attribute + 0~N Attribute | Distribution of [metric] by "geo attribute" | What is the Revenue by City? | Map | |
2 Metrics + 1 Attribute | Correlation between "metric 1" and "metric 2" by [attribute] | Can you tell me the correlation between Cost and Revenue by Customer Age? | Scatter-plot | |
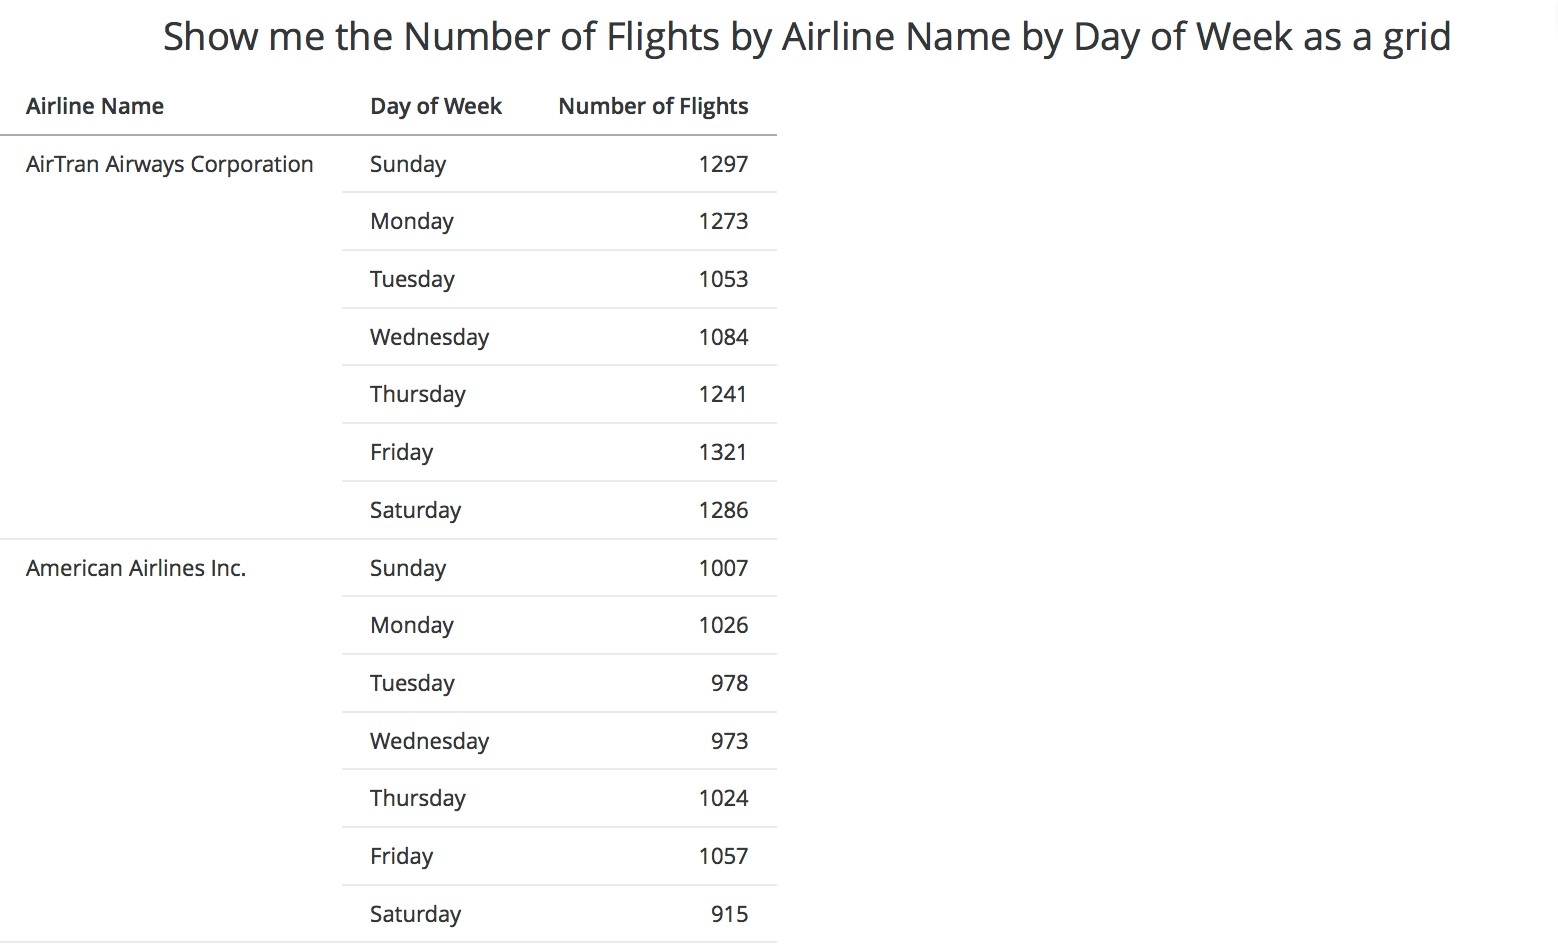
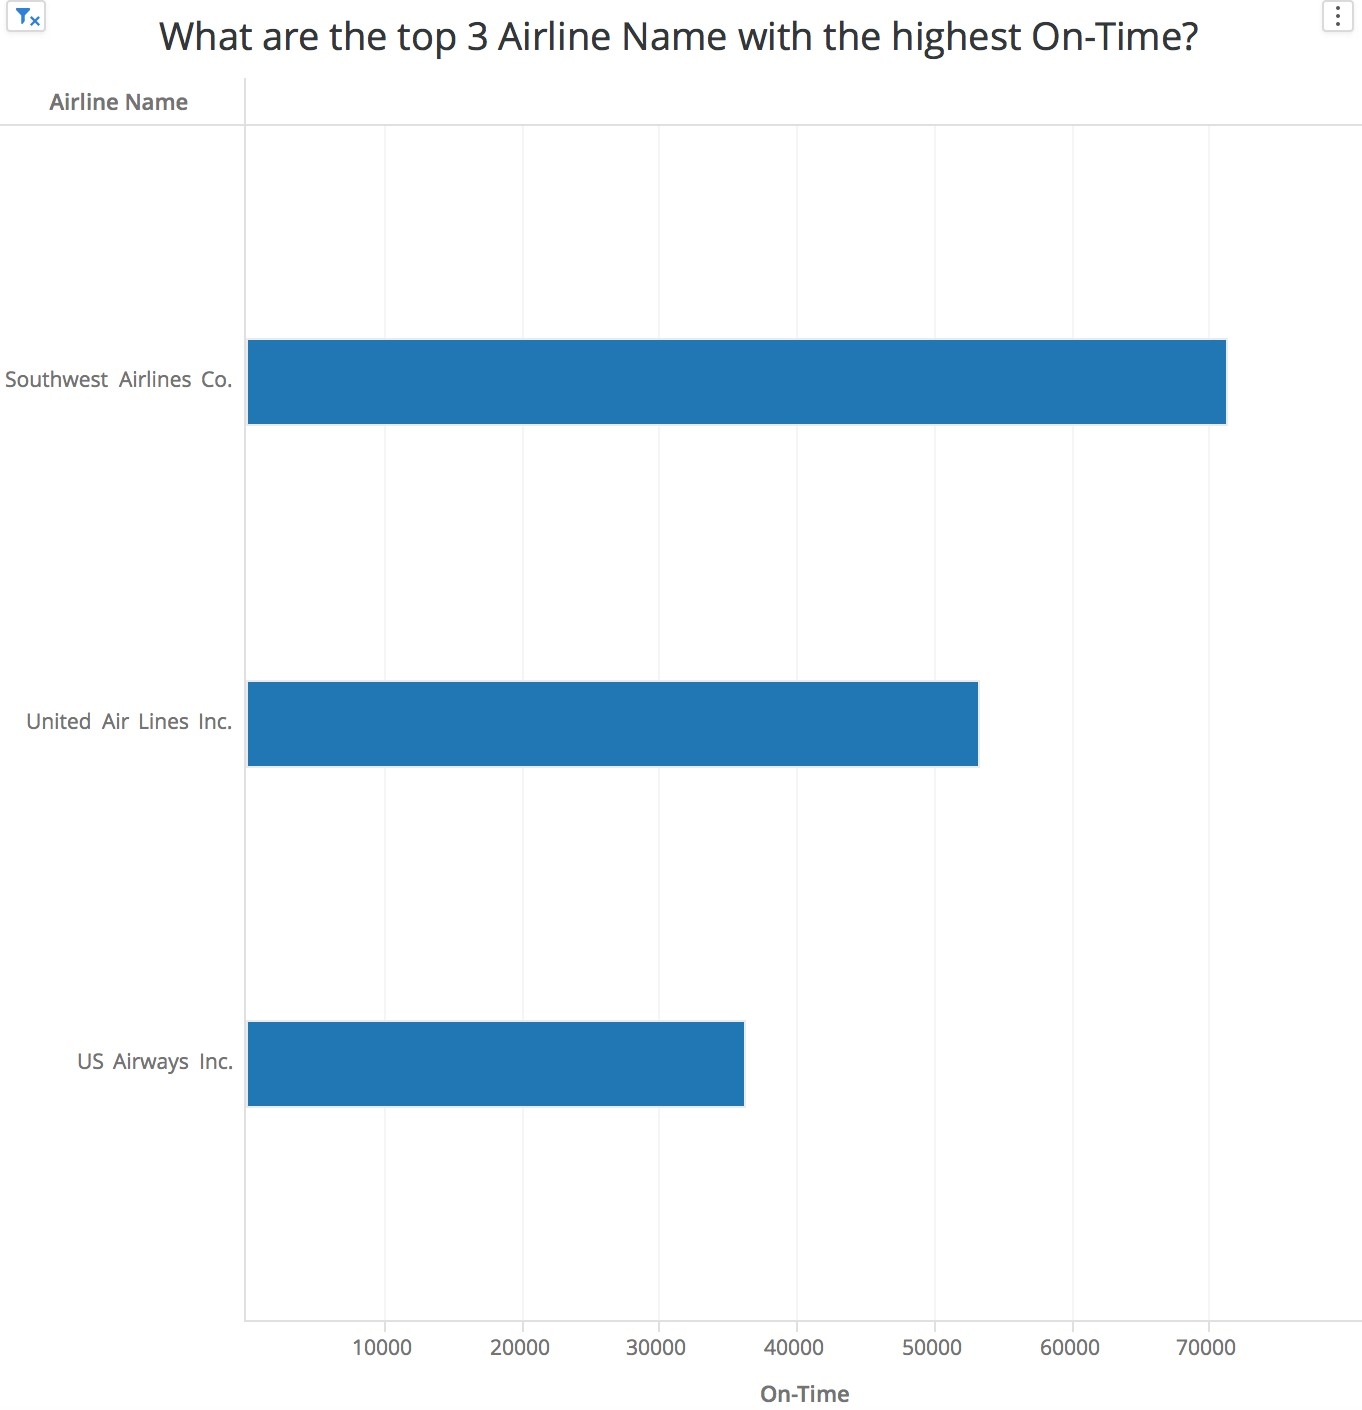
0~N Metric + 1~N Attribute | What is [metric] by "attribute 1" and by "attribute 2" | What is the Profit by Item and by Customer Gender? | Bar Graph |
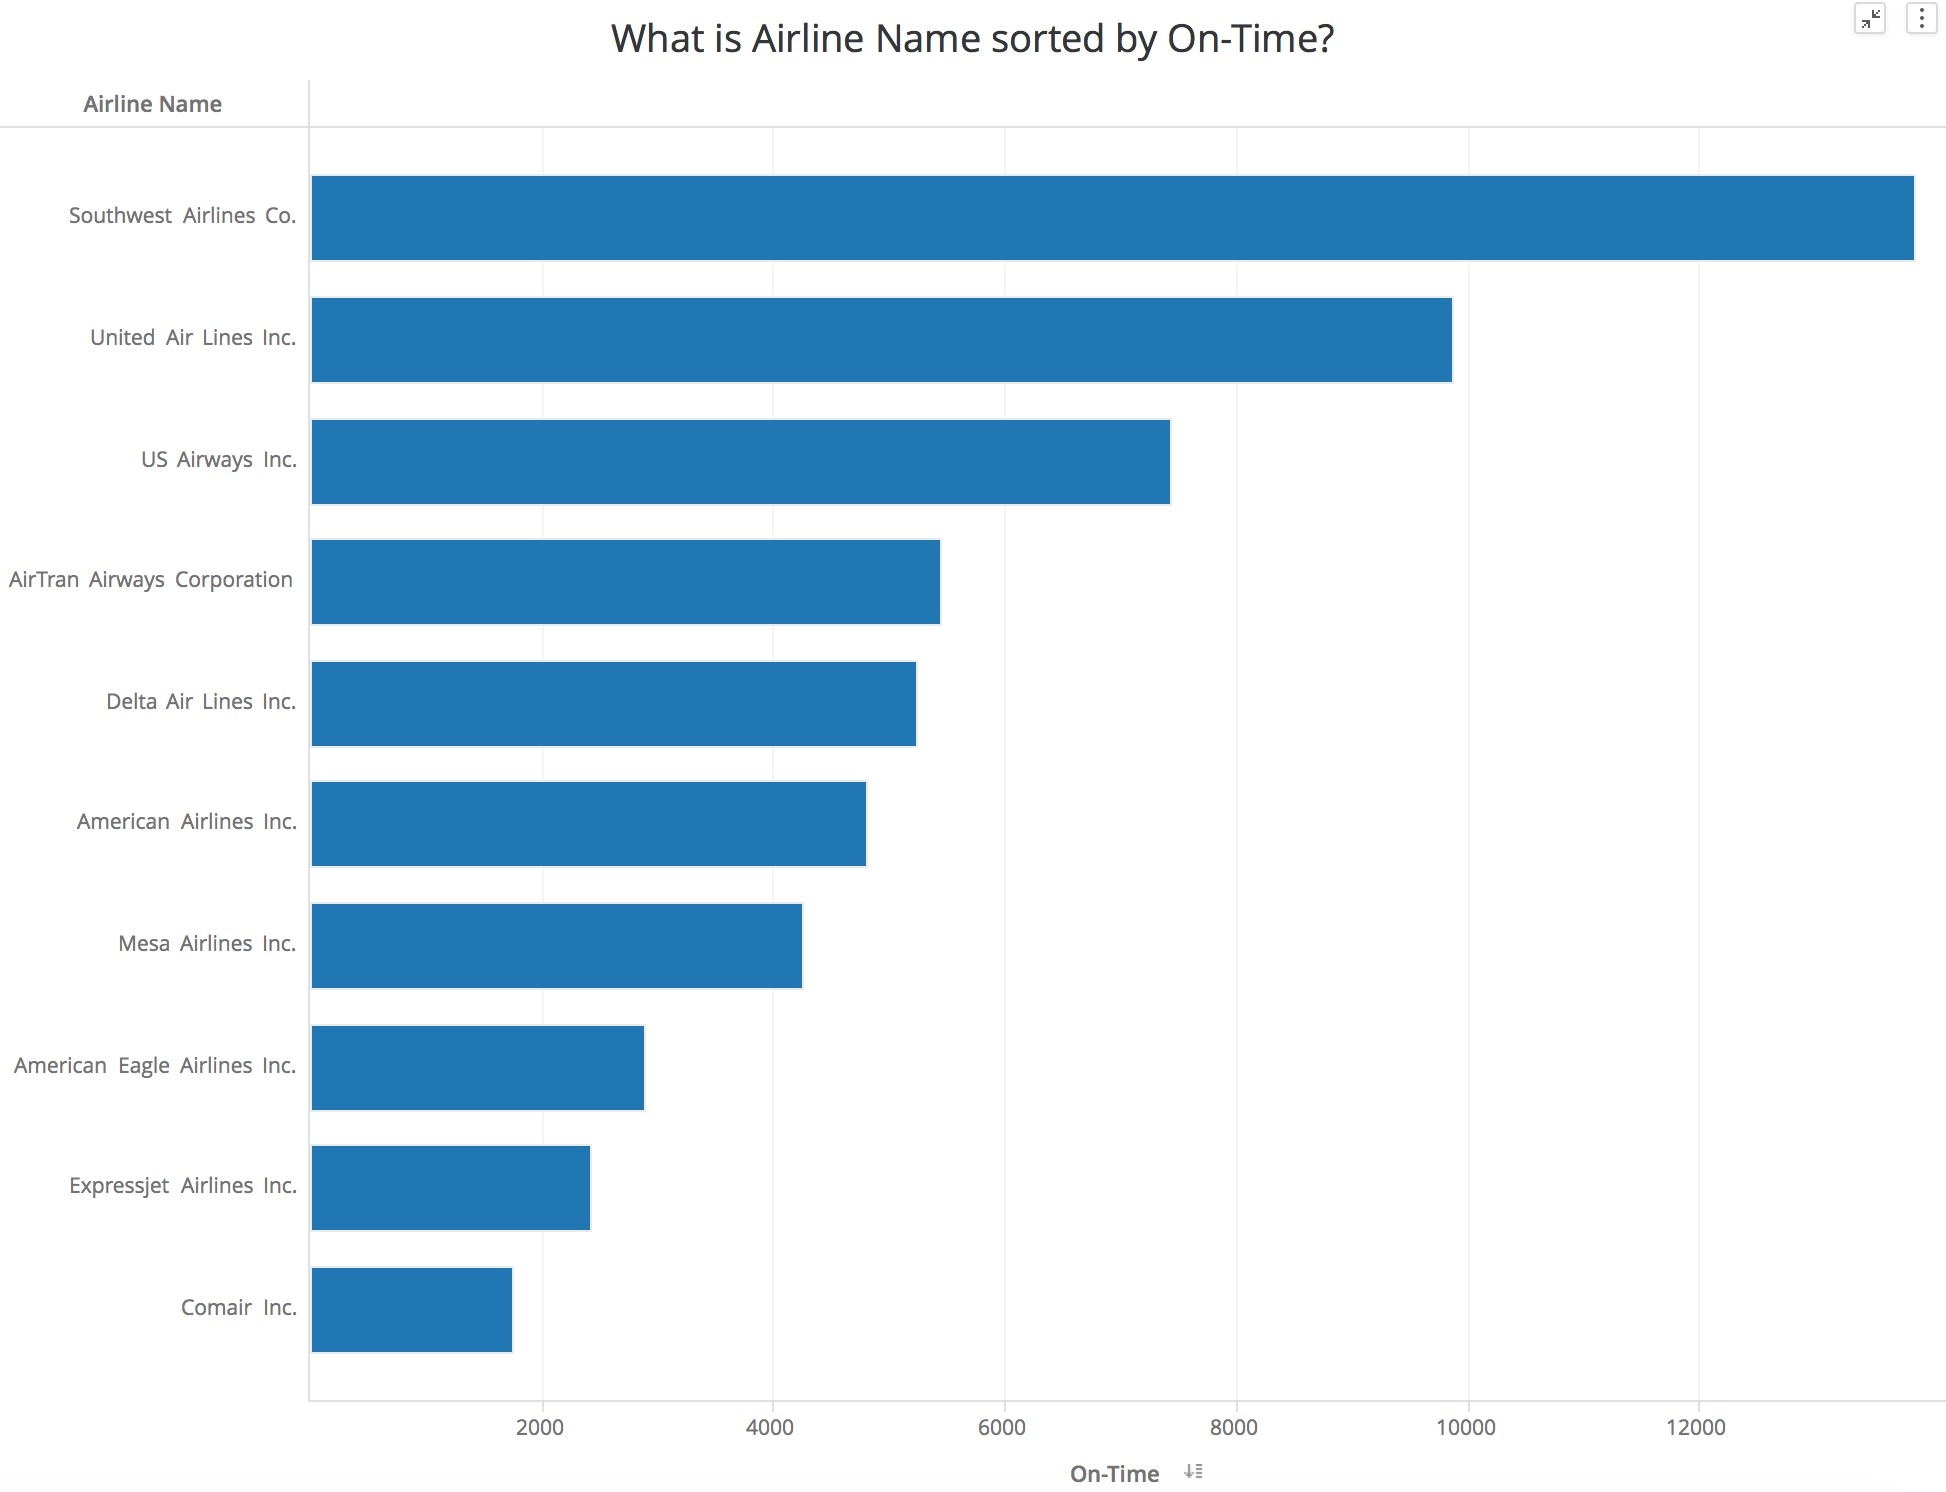
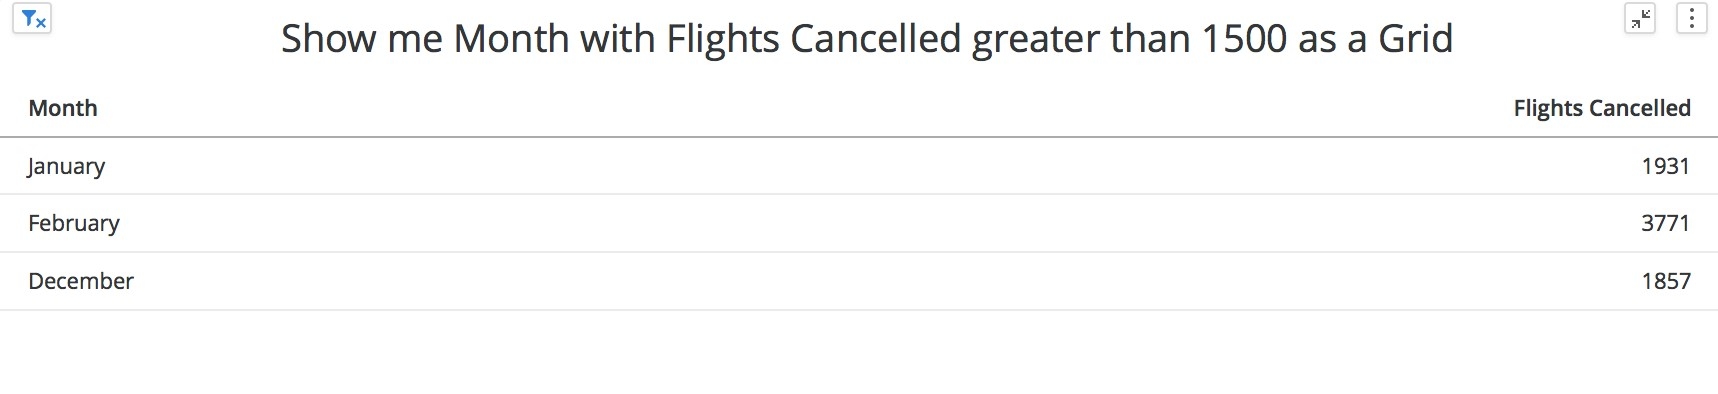
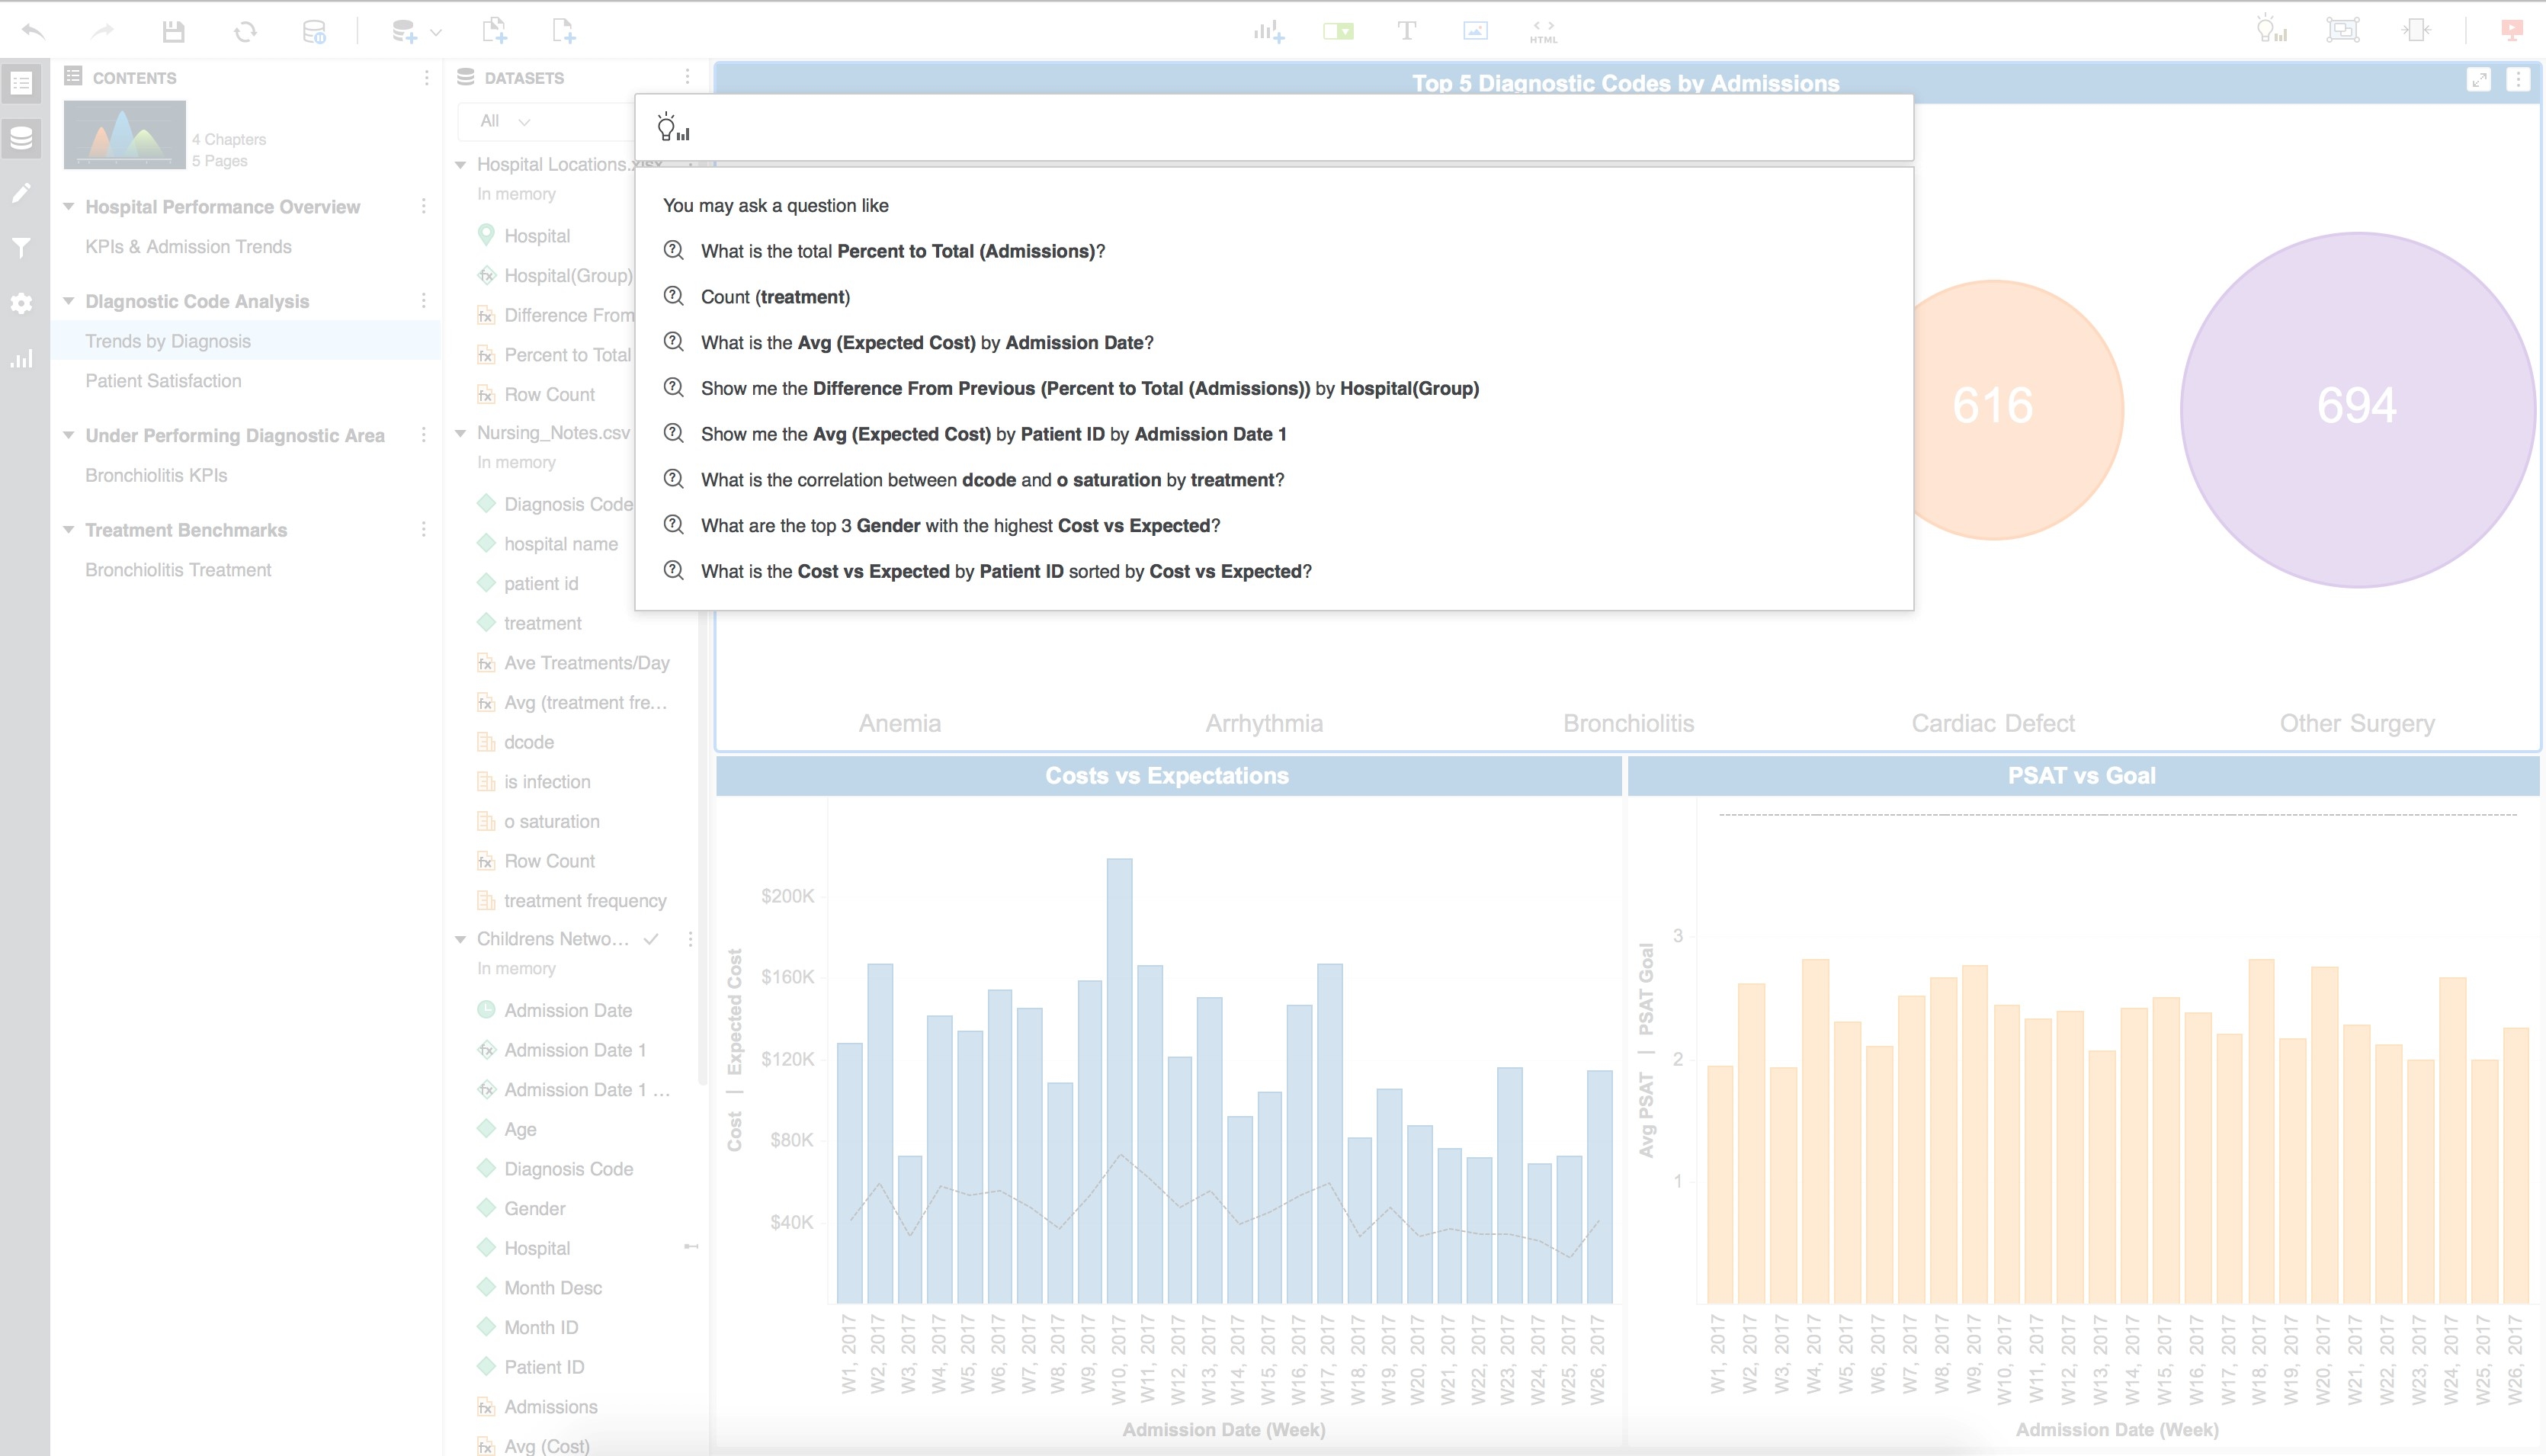
Within the filtering condition of the created visualization, you can see that an advanced filter condition, “[Flights Cancelled] Greater than [1500]”, was created. This was translated from natural human language to a filter on a MicroStrategy visualization.
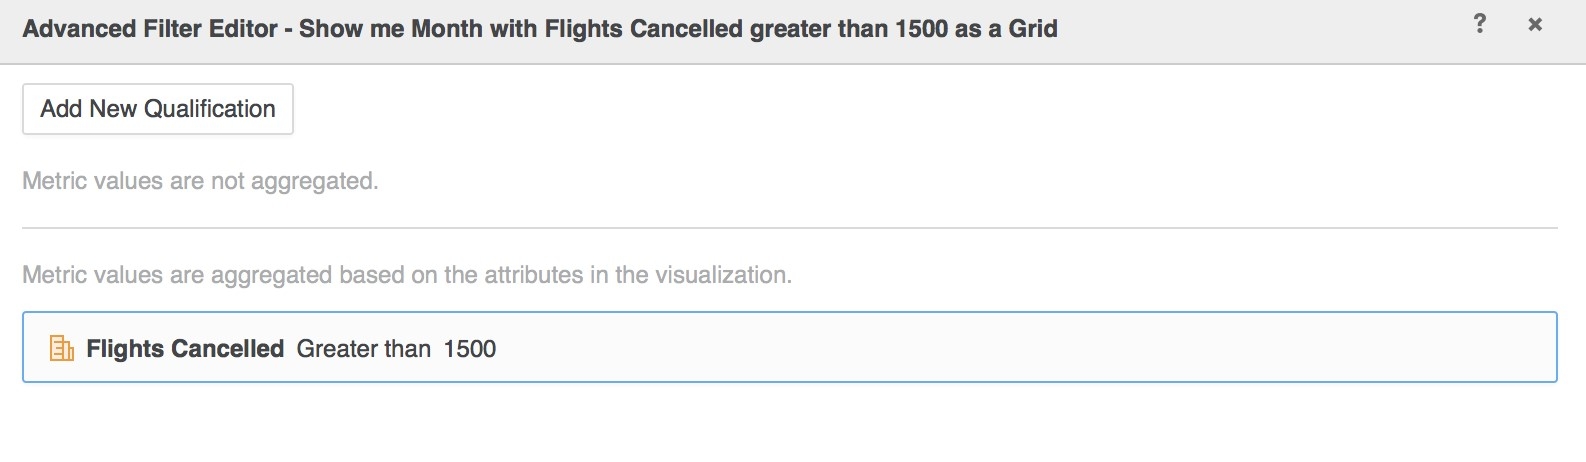
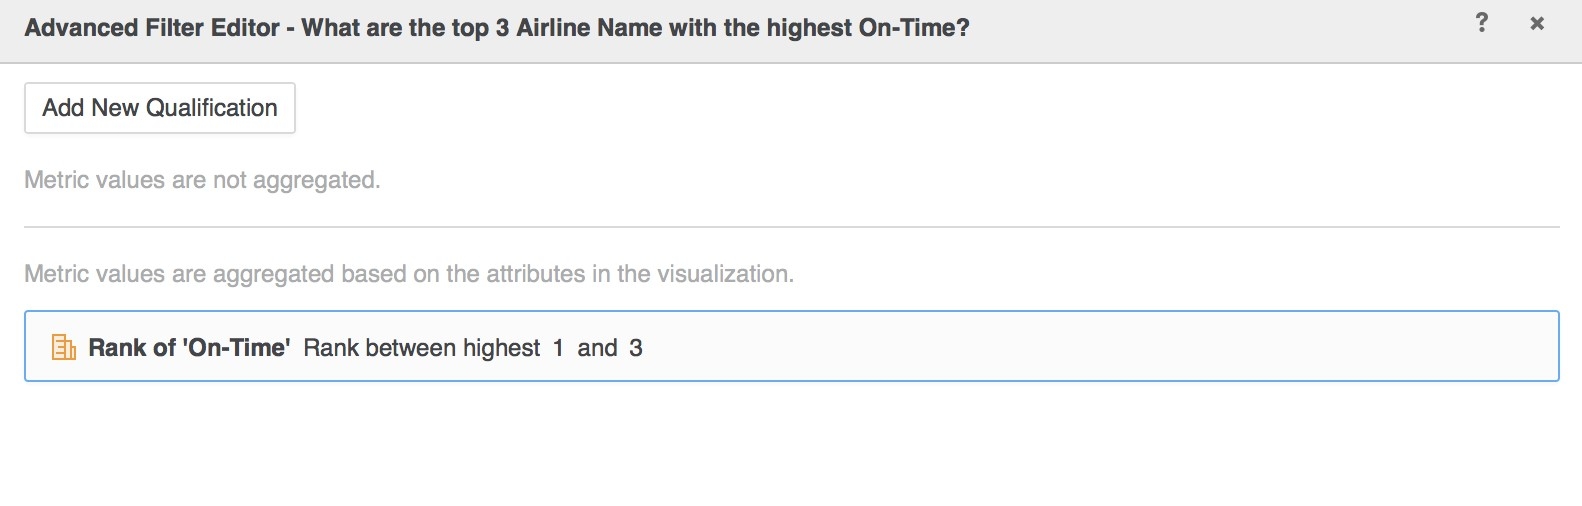
With this query, an advanced filter was created: