Starting with the release of Strategy ONE (March 2024), dossiers are also known as dashboards.
Description
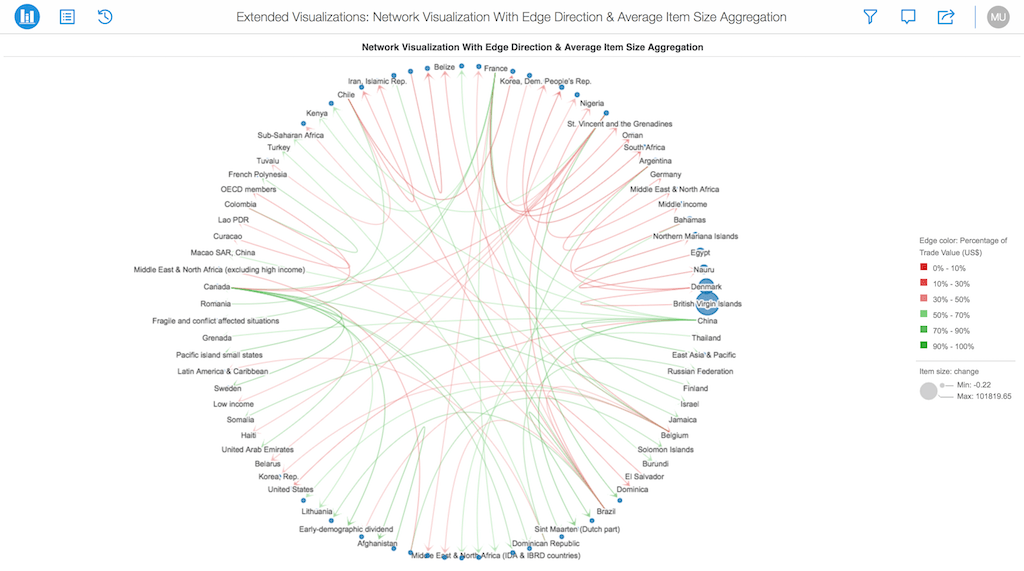
You can add a Network Visualization to your dossier quickly and easily to identify relationships between related items and clusters. Attribute elements are displayed as nodes in the visualization, with lines drawn between the nodes to represent relationships between the elements. Once the visualization is created, users can view characteristics of the nodes and the relationships between them, using display options such as node size, edge thickness, and edge color.
Also known as the Network Graph, the visualization displays undirected and directed graph structure.
View the image below for a quick glance at the visualization:
Minimum Strategy version: 10.9
Publisher: Strategy
To view this dossier with the visualization:
Analyze using network visualizations by downloading MicroStrategy Desktop!
A project in beta by ferdio, (2017, December 4th). Retrieved from http://datavizproject.com/
Interested in learning more about Dossier authoring? Visit the Learning Center on Community!
Or feel free to go to our Documentation pages for product information.
