EducationSoftwareStrategy.com
StrategyCommunity

Knowledge Base

Product

Community

Knowledge Base

TopicsBrowse ArticlesDeveloper Zone

Product

Download SoftwareProduct DocumentationSecurity Hub

Education

Tutorial VideosSolution GalleryEducation courses

Community

GuidelinesGrandmastersEvents
x_social-icon_white.svglinkedin_social-icon_white.svg
Strategy logoCommunity

© Strategy Inc. All Rights Reserved.

LegalTerms of UsePrivacy Policy
  1. Home
  2. Topics

Org Chart World


Evan Norris

Content Engineer • Strategy


Visualize the hierarchy of an organization with relevant insightful data. Org charts let organizations quickly and easily visualize their workforce in real time, helping executives make informed decisions about hiring, performance and accountability, allowing employees to find and collaborate with coworkers, and providing the framework for communicating operational information and managing change.

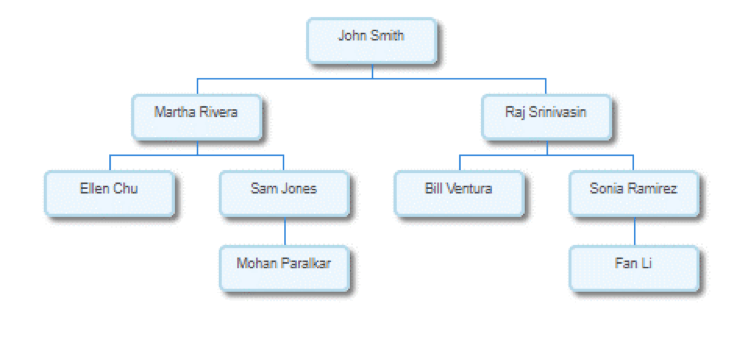
In addition to being used to visualize workforce hierarchies, org charts can also be used to visualize other hierarchies, such as family trees.  

ka0PW0000000nrxYAA_0EM2R000000nPjZ.jpeg

Requirements
Object requirements: 

  • Attributes: 2
    The first and second attributes establish the relationship. The first attribute represents the manager, and the second attribute represents the employee.
  • Metrics: 1
    Row count metric (automatically added to the dataset).

Minimum Strategy version: 10.3
Current visualization version: 1.0
Publisher: Strategy 
Strategy Features 

  • Supports custom properties  (10.3 and later)

Installation instructions

  • To install this visualization, download the .zip file below and deploy it in Strategy Desktop or Strategy Web. 
  • After you have installed the visualization, you can open a working demo of this visualization by uploading the .mstr file below and doing the following:
    • To open the demo visualization in Strategy Desktop, double click the .mstr file.
    • To open the demo visualization in Strategy Web, choose Create -> Upload Strategy File -> View Dashboard.

Visualization Disclaimer
By downloading or using this visualization, you accept and acknowledge these terms.
 
This visualization is both intended as sample code and provided as a convenience to Strategy users. Strategy cannot guarantee that the code provided will apply to any Strategy releases and clients outside of the versions stated within this article. This sample is supported by Strategy Technical Support up to and including the basic visualization functionality listed in this article. Defects will be triaged by the Strategy team as they are raised. For users with active Strategy Technical Support contracts, contact Strategy Technical Support to raise these defects.
 
Anyone seeking to use this visualization is encouraged to review and adapt this sample based on user requirements. Contact Strategy Professional Services for assistance with these same adaptations. If users would like to provide feedback on or recommendations for this visualization, post in the comments section of this article.


Comment

0 comments

Details

Example

Published:

April 6, 2017

Last Updated:

February 16, 2024