Starting with the release of Strategy ONE (March 2024), dossiers are also known as dashboards.
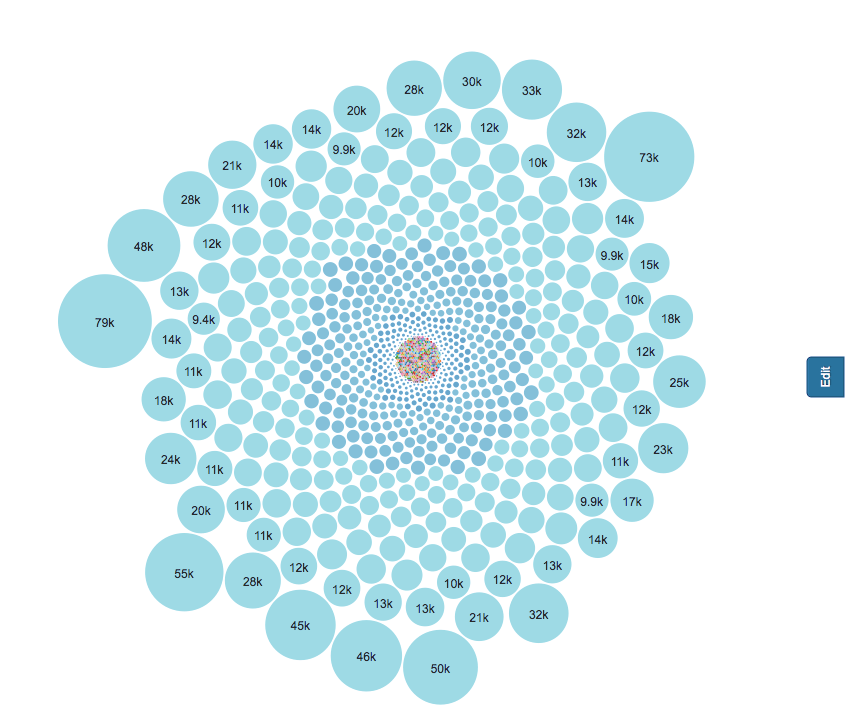
A Packed bubble chart is a cluster of circles where we use dimensions to define individual bubbles, and the size and/or colour of the individual circles represent measures or Metrics. Bubble charts have many benefits and one of them is to let us spot categories easily and compare them to the rest of the data by looking at the size of the bubble. This simple data visualization technique can provide insight into a visually attractive format.
Minimum Strategy version 10.3
Chart Version : 3.8
MicroStrategy Features
Vitaracharts is now FREE for Desktop and Workstation.
Please contact sales@vitaracharts.com to get a 30-day trial key.
Take note that this visual is a part of the VitaraCharts library.
Download visualizations: www.vitaracharts.com
Online interactive visualizations can be accessed here: https://cloud.vitaracharts.com
Publisher: Vitara
Vitara is a Strategy technology partner and offers a fully supported, production-ready chart plugin (VitaraCharts) with 30+ stunning visualizations to enhance Strategy analytics. All Vitara visualizations are customizable and supported through upgrades for a hassle-free experience. We perform extensive testing for backward compatibility with all currently certified versions of Strategy and also ensure all new versions of Strategy are tested and supported across all charts.
For more details please contact sales@vitaracharts.com or www.vitaracharts.com.