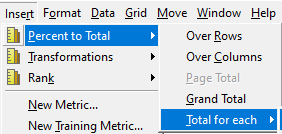
Doing this, you select one of the attributes on the report for which the shortcut metric must calculate the % to Total for (level). The limitation of this method is that the specified attribute must be on the report and if the user chooses to have other attribute levels, new shortcut metrics need to be defined for those.
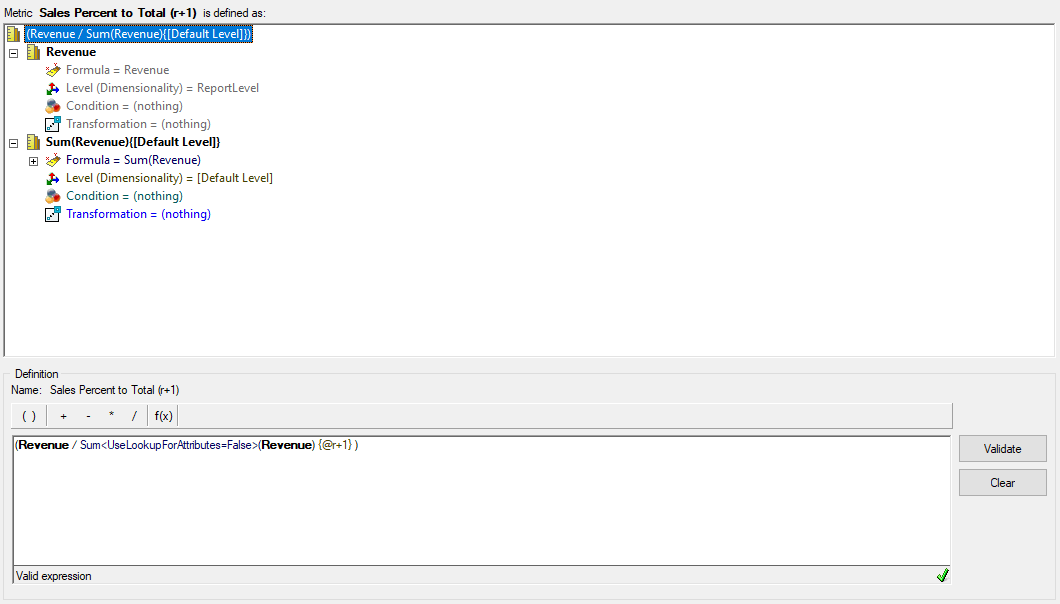
There is another way to dynamically specify at which level the % to Total must be calculated. This is done, based on the position of attributes that are present on the report. By adding “{@r+1}” after the metric to be used in the calculation, you dynamically force the derived metric to be calculated at the level of the attribute that is one position to the left of the first row attribute when counting from right to left.
Consider the example below:
On a report, there are the attributes Category, Subcategory and Brand and the metric for Revenue. When adding the derived metric above, the % to Total will be calculated at the level of Subcategory, which is the attribute that is 1 position to the left of the lowest level attribute (Brand). For illustration, a similar metri has been added, but it uses “{@r+2}”, which means the attribute 2 positions left of Brand, which is Category.
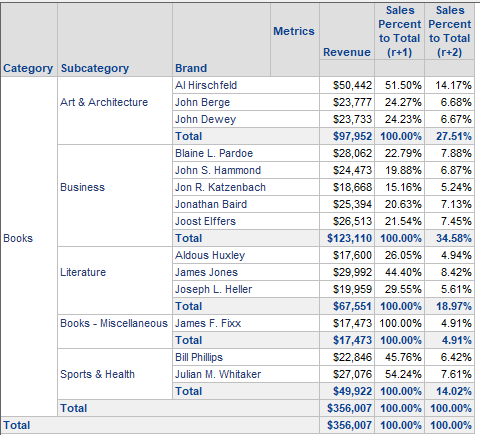
Note that the r+1 metric adds up to 100% for each Subcategory (1 position to the left of Brand), whereas the r+2 metric adds up to 100% for each Category (which is 2 positions to the left of Brand)