Starting with the release of Strategy ONE (March 2024), dossiers are also known as dashboards.
The vision of Strategy is Intelligence Everywhere. Our analytics and mobility platform transforms data into actionable insights that help people make better business decisions. By the same token, our platform is also the source of valuable data. Every time that a user does something in Strategy, like running a dossier, publishing a cube, or creating a subscription, the Strategy platform generates data (also known as telemetry) about that event. And because we are an analytics company, we take advantage of this wealth of information to make the Strategy platform more intelligent.
That is why with Strategy 11.0 we are introducing a new monitoring tool called Platform Analytics (PA). Platform Analytics captures telemetry from the Strategy platform in real-time, and then it presents this data to the administrators, developers, and analysts to help them optimize the performance of their Strategy system, offer personalized recommendations to their business users, improve their analytics apps, secure their data, and more.
One key principle behind Platform Analytics is the democratization of telemetry. Instead of storing telemetry in a warehouse and using it to create administrative reports only, Platform Analytics captures telemetry and spreads it to other parts of our platform. This makes it easier for more users to find the telemetry and gain insights while using other Strategy products, without having to rely on administrative reports that those users may not understand, have access to, or even know that exist.
Let’s look at one example. Laura is a developer who created the ‘Team Capacity and Load’ dossier a few days ago and wishes to know how many people have run this dossier and how fast it runs on average. Thanks to Platform Analytics, all she needs to do is right-click on her dossier in Workstation and go to the Activity tab where she will find the answer to this and other key questions. Quick and easy!
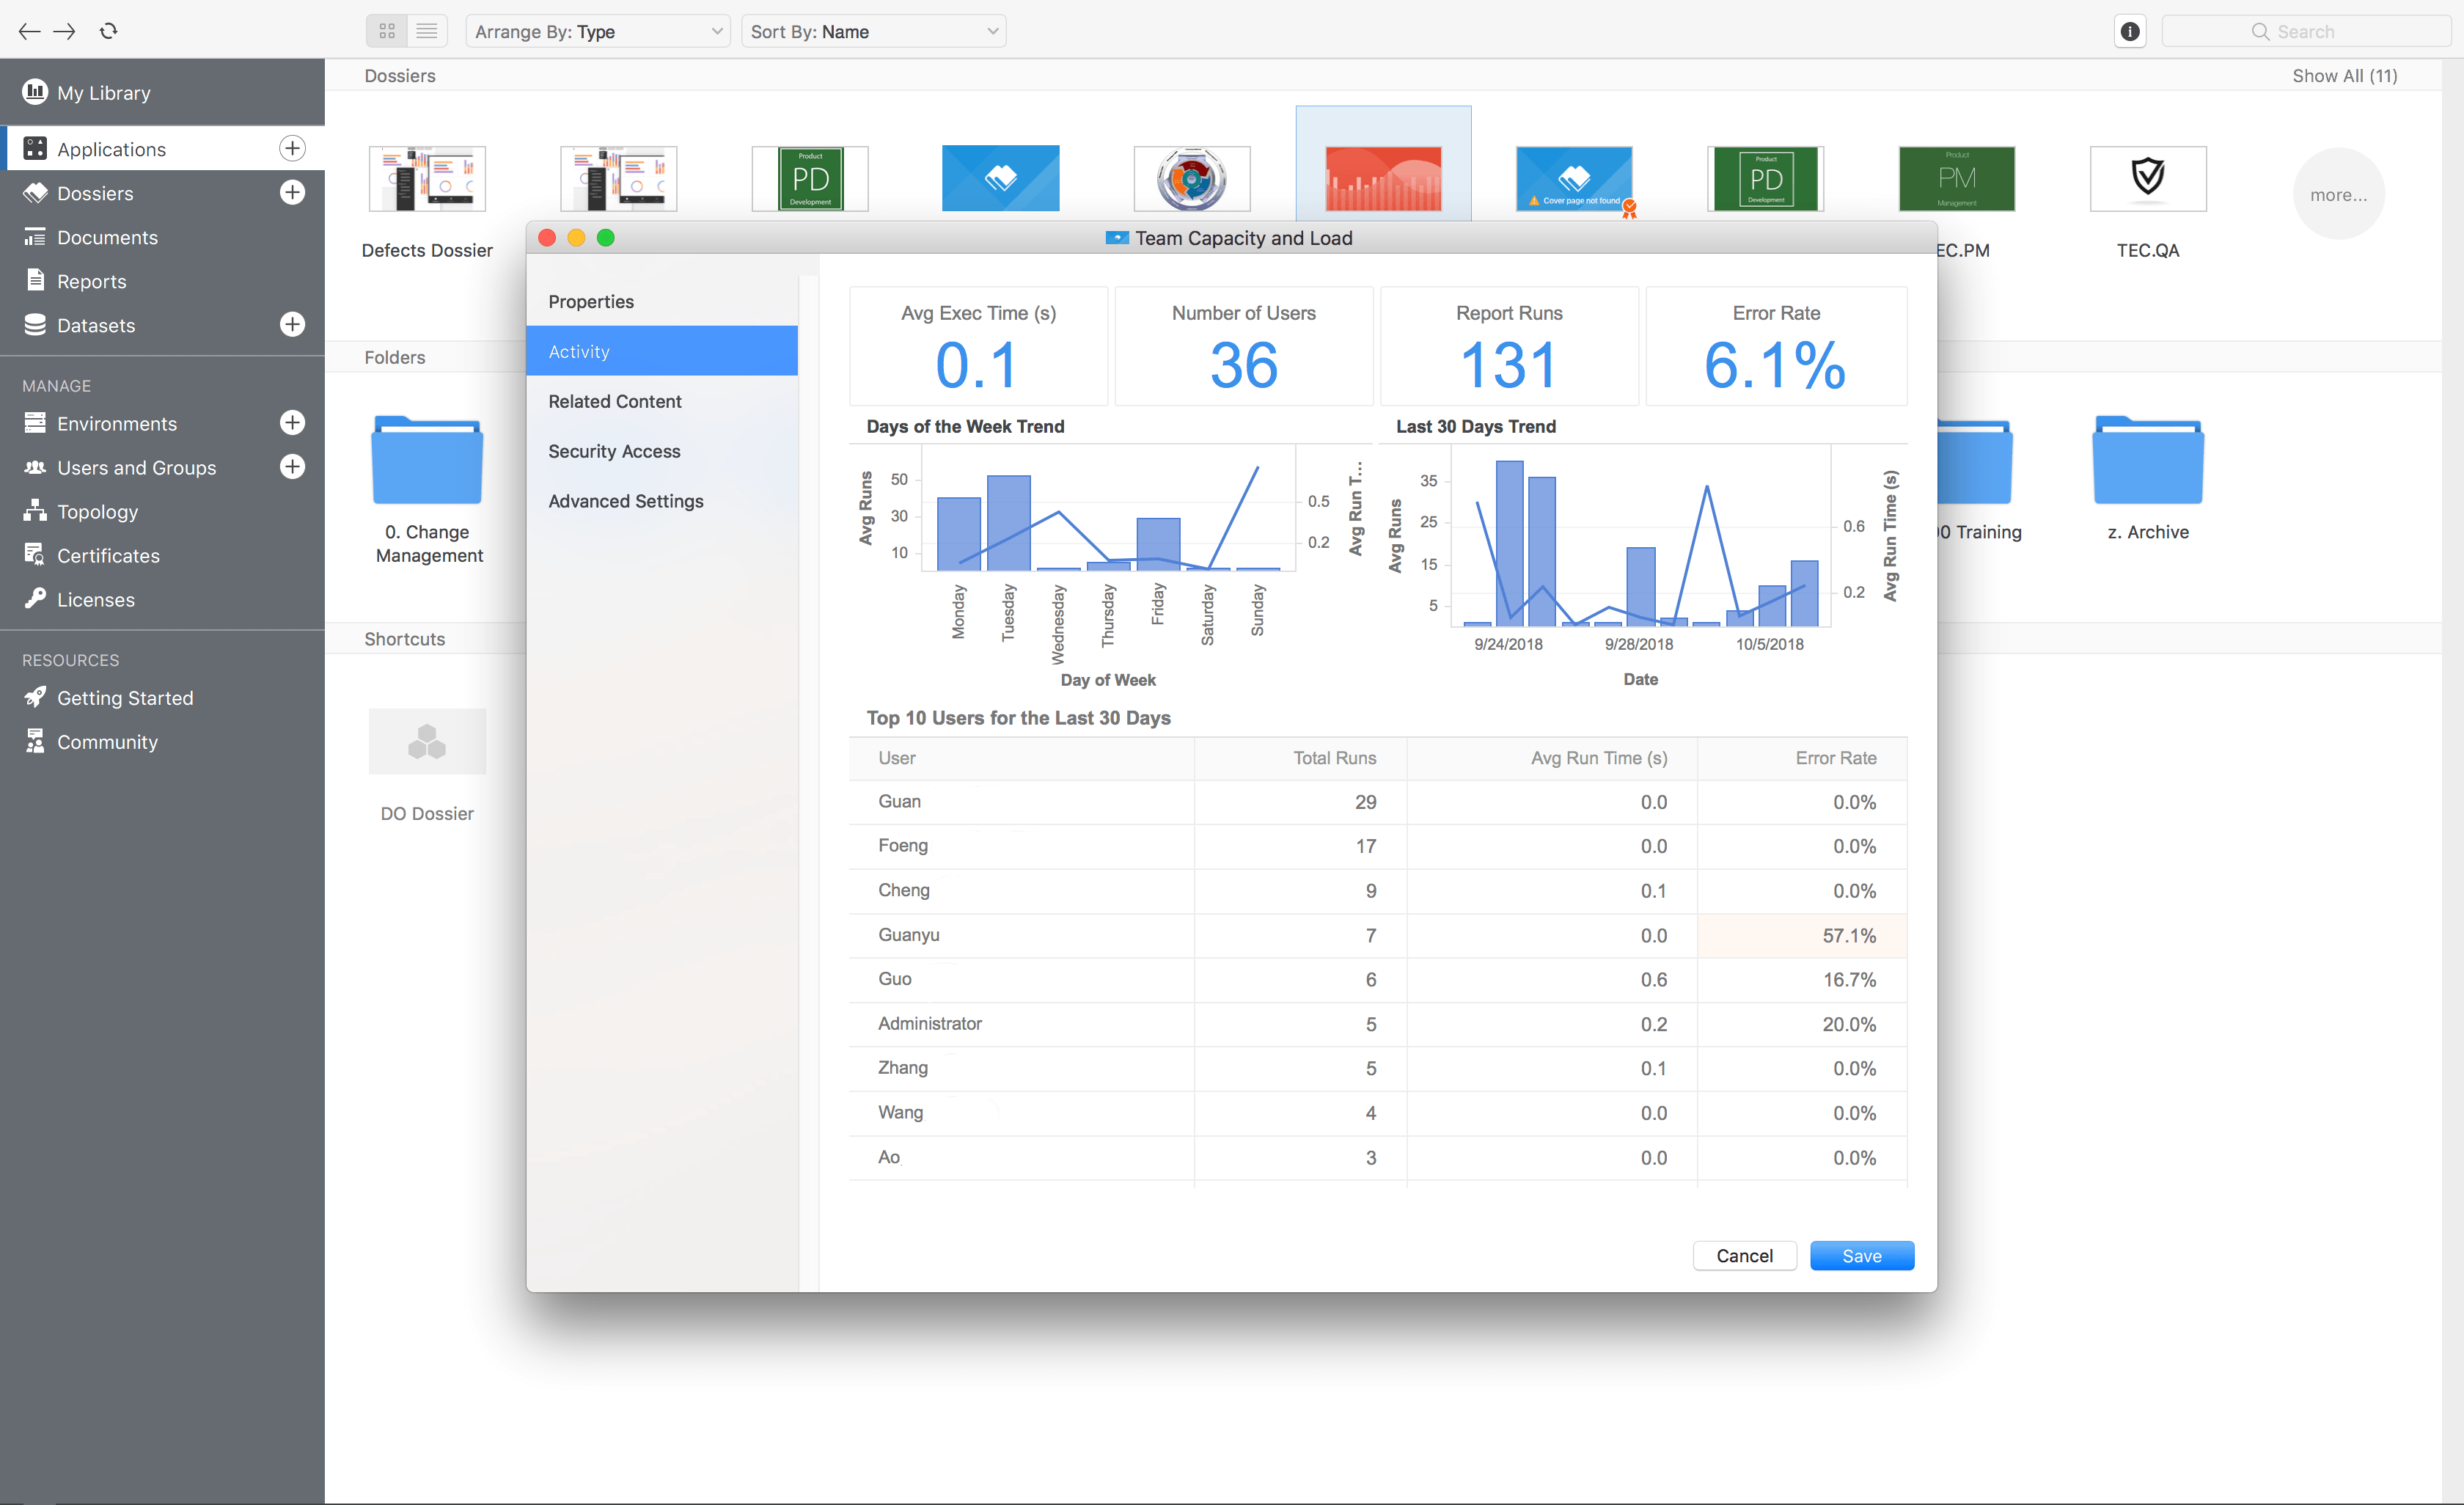
Embedded Dossier Telemetry in Workstation
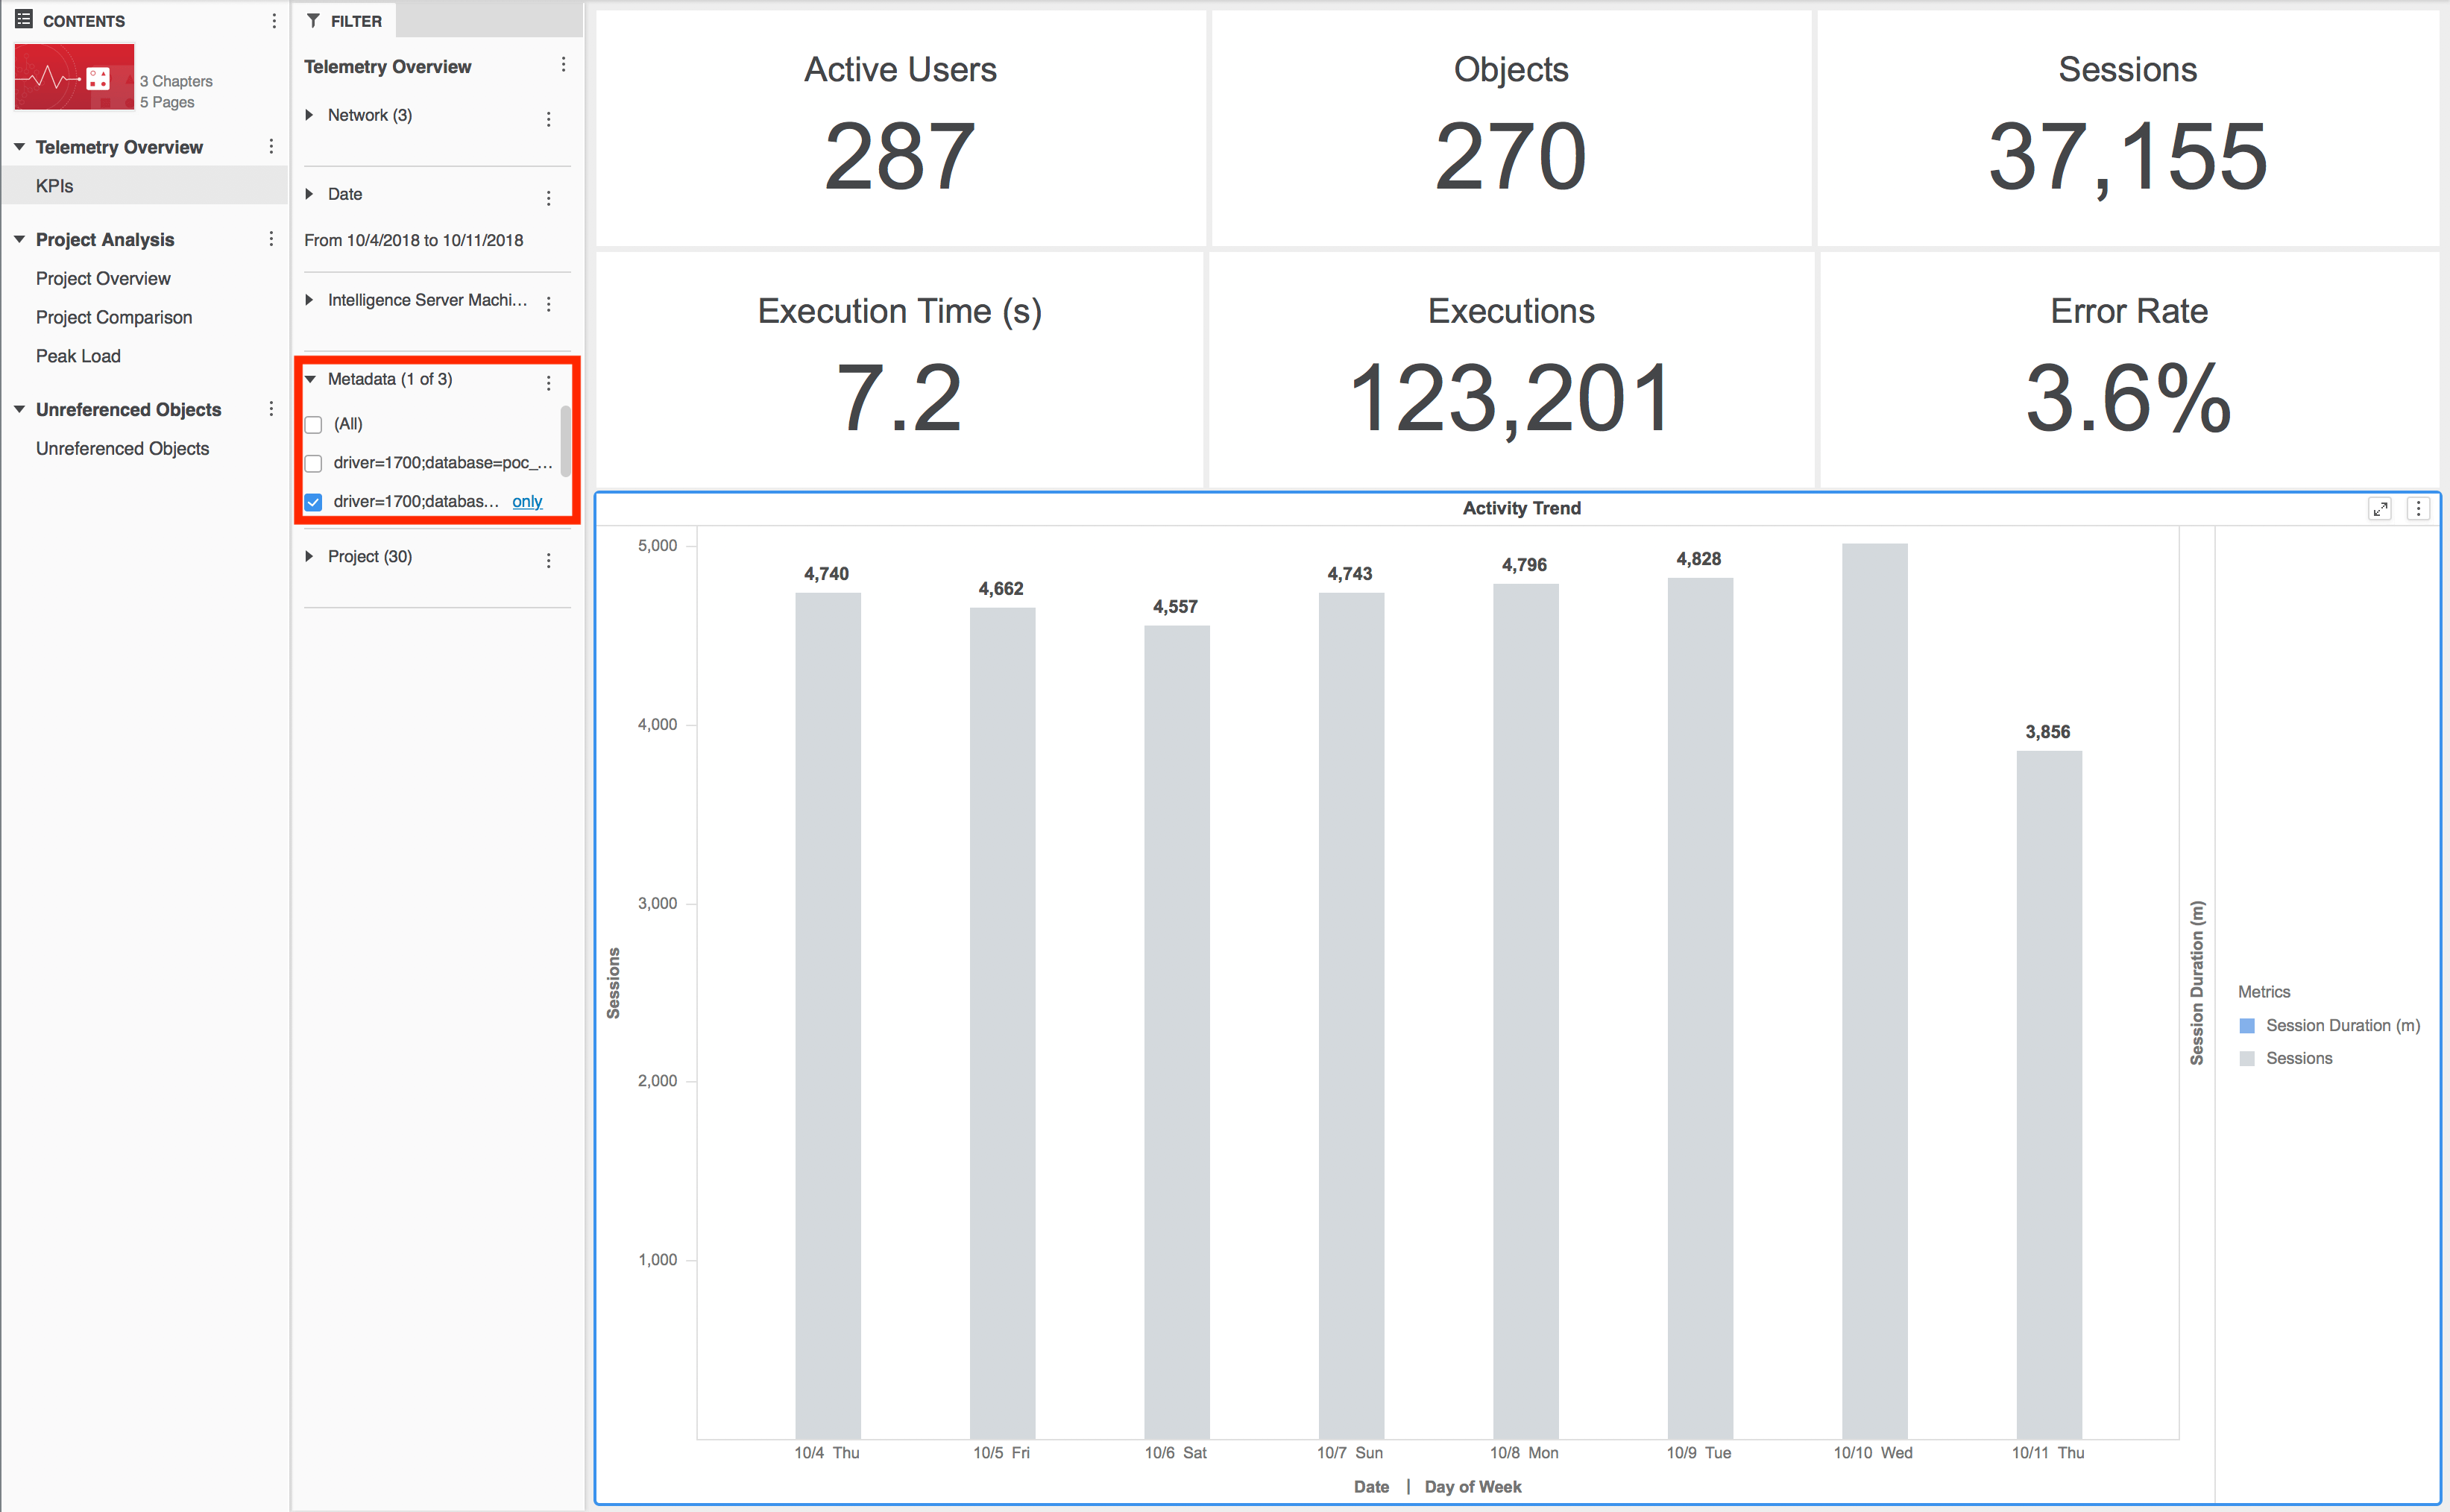
If Laura wants to get more details about the adoption and usage of her dossier, she can go to the out-of-the-box Platform Analytics project and run one of the default Platform Analytics dossiers included there. These dossiers provide a lot more granularity about the telemetry generated by our platform. Alternatively, Laura can create a dossier using the self-service schema (attributes and metrics) which is included out-of-the-box with the Platform Analytics project.
Platform Analytics captures more data from the Strategy platform than ever before. We are literally talking about thousands of events and data points from all the key areas of the platform. This data is captured in real-time and can be accessed by running the default Platform Analytics dossiers, creating ad-hoc dossiers using the Platform Analytics schema, and using the telemetry embedded in Workstation.
The list below provides a few examples of the type of telemetry captured by Platform Analytics:
In order to capture all of this data Platform Analytics uses a modern messaging streaming architecture that provides 3 key benefits: scalability, performance, and redundancy. This architecture allows a single instance of Platform Analytics to monitor multiple Strategy environments simultaneously and in real-time.
Let’s look at another example. Acme Co. has a Strategy implementation with 4 environments: Development, QA, Mirror, and Production. John is the Strategy administrator in Acme. Previously, Acme had to monitor each Strategy environment individually, and John had to create the same set of monitoring reports for each environment. However, now that they are using Platform Analytics, Acme can monitor its 4 environments using a single instance of Platform Analytics. To access data from all the environments John runs the Platform Analytics out-of-the-box dossiers, and then he uses a simple filter to select the specific environment (i.e. Intelligent Server cluster connecting to a metadata) that he wishes to analyze.
With Platform Analytics, Strategy customers can optimize the performance of their Strategy implementations, improve their analytics apps, troubleshoot issues, and ensure that all their users get the best possible analytics experience. And this is just the beginning. Come back to see all the functionality that we will be adding to this powerful tool in the next months.
Interested in learning more about Platform Analytics? Visit the Learning Center on Community!
Or feel free to go to our Documentation pages for product information.