Starting with the release of Strategy ONE (March 2024), dossiers are also known as dashboards.
Platform Analytics and Kafka Messaging Services are two heavily dependent products that are part of Strategy 2019. This document explains how to configure these products through installation and post-installation operations in order to setup a Broker Cluster and Platform Analytics Project.
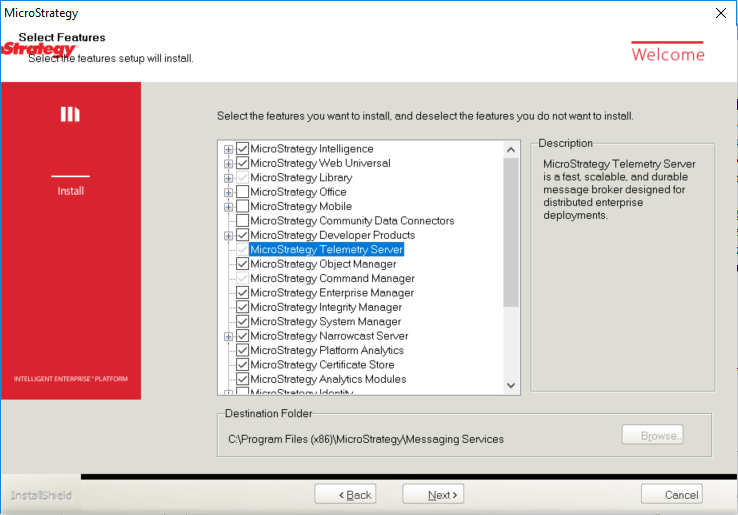
The Telemetry Server (referred to as Kafka Broker) gets installed on all machines with Strategy server components by default.
This can also be installed as a stand-alone component on additional machines. Notice the check box in the image below:
There is an additional screen in the installation that gives the option to configure the Telemetry Server in a cluster.
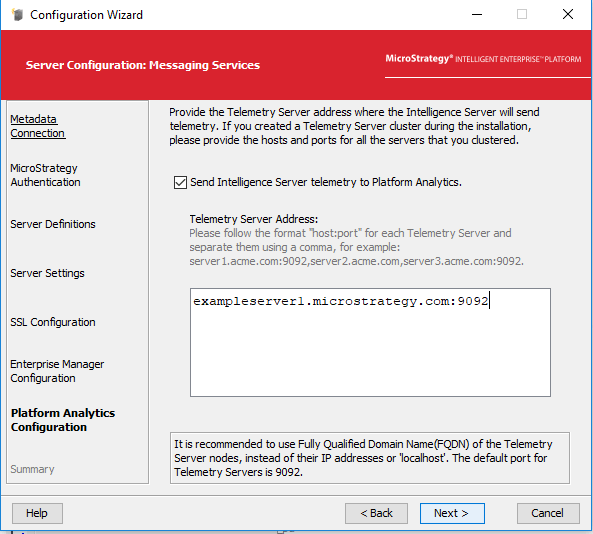
If you want the current machine to act alone, and not in a cluster, leave the screen as is, and click next:
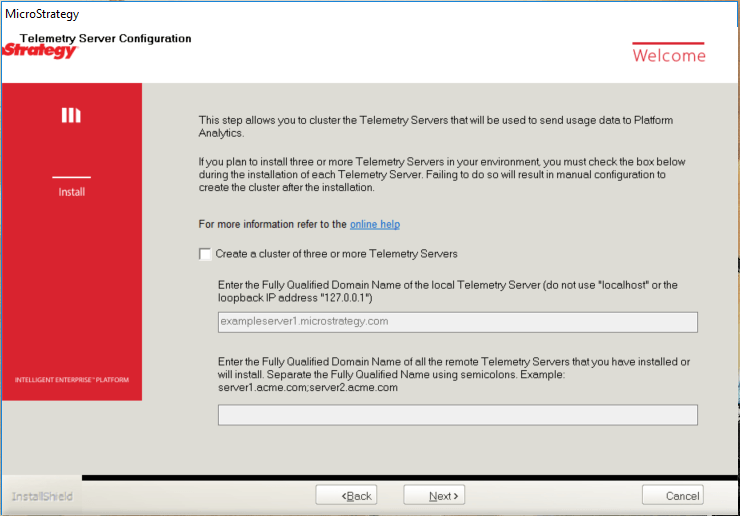
If it is desired to use a Telemetry Server Cluster for failover:
During the installation of the other Telemetry Servers on other machines, list the servers in the same manner for each of the other Telemetry Server Cluster Nodes.

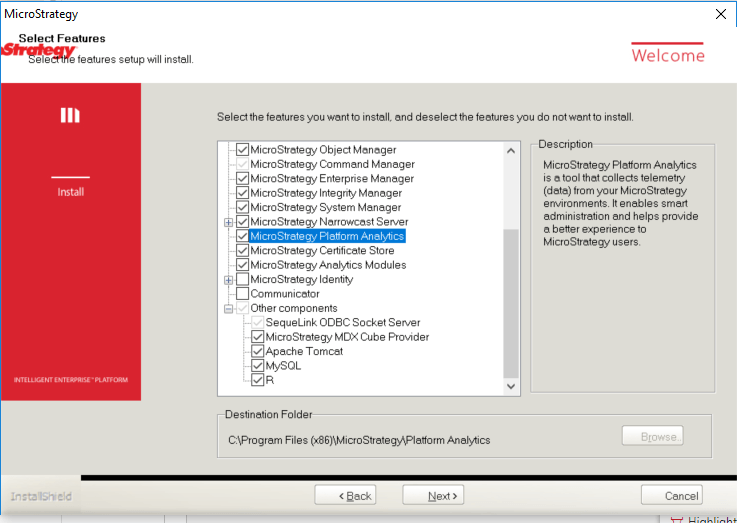
Platform Analytics gets installed on one machine only. It is recommended that it gets installed a machine separate from your Intelligence Server machine, and if using the automatically installed MySQL instance the same machine as the MySQL deployment.
Note the checked box in the image located below:
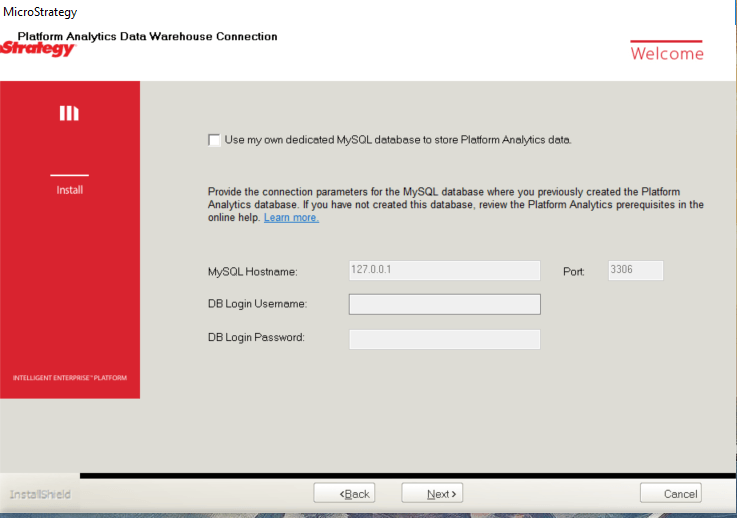
Platform Analytics uses MySQL as the Platform Analytics Data Warehouse. MySQL can be selected for installation on the Select Features screen. The option to use a separate MySQL database also presents itself in the installation.
To use the out-of-the-box MySQL database, don’t do anything on the screen shown below. To use a separate MySQL database, check the box, and fill in the details of the other database. Note that if the MySQL is not checked in the Select Features screen, then it is required to provide the credentials for an active MySQL warehouse.
The Intelligence Server needs to be configured to generate statistics for Platform Analytics.
It can be configured in Configuration Wizard, under Configure Intelligence Server or through Command Manager.
To setup Platform Analytics through Command Manager, two commands need to be run to update the settings.
Depending on the status of the Intelligence Server Producer this may or may not require an Intelligence Server restart.
The first command should be to alter the Intelligence Server Configuration to enable Messaging Services and set the Kafka Broker or Brokers within a cluster:
ALTER SERVER CONFIGURATION ENABLEMESSAGINGSERVICES TRUE CONFIGUREMESSAGINGSERVICES "bootstrap.servers:<Telemetry Server IP>:<Telemetry Server port>/batch.num.messages:5000/queue.buffering.max.ms:2000";
The second command will need to be executed for each project that Platform Analytics data is desired on and allows for choosing additional Statistics not enabled during Configuration Wizard:
ALTER PASTATISTICS BASICSTATS ENABLED IN PROJECT "<PROJECT_NAME>";
After either the Command Manager scripts or Configuration Wizard operations are completed it is important to verify that execution was successful. The List Properties commands should indicate success.
The next step is to create the Platform Analytics project in Configuration Wizard.
It will require a login to the Platform Analytics Warehouse DSN:
The username will be “mstr” by default or what is specified during installation, and is configurable inside of <install>\Platform Analytics\conf\PAConsumerConfig.yaml.
In Strategy 2020, the username is "mstr_pa" by default.
The default password if it is selected for a MySQL database to be installed by Strategy can be found in the express_password text file, which is by default under C:\Program Files (x86)\Common Files\Strategy.
In Strategy 2020, the password can be found in the Default_Accounts.txt file.
The Platform Analytics project comes with three Intelligence Cubes that support nine Dossiers that can be run right after installation to check if everything is functioning properly. They just need to be set to publish as well as trigger the initial Object Migration. This can be done through Command Manager. Open Command Manager and run the script found in <install>/PlatformAnalytics/util as PlatformAnalyticsProjectConfiguration.scp.
The initial Object Migration can take some time depending on the size of the Metadata, if this needs to be re-triggered for any reason there is an Event that can be triggered within the Developer Client or the Command Manager script can be re-executed.
Interested in learning more about Platform Analytics? Visit the Learning Center on Community!
Or feel free to visit our Documentation pages for step-by-step guides and instruction.