Starting with the release of Strategy ONE (March 2024), dossiers are also known as dashboards.
This visualization created using MicroStrategy 2021 and Vitaracharts showcases population shifts from 2017 vs 2100. Although China and India swap the number 1 spot, the overall population size in the top countries is projected to decline. The Vitara Slope Chart visualization shows rank change and includes a custom marker showing an icon for humans at each end to add more context.
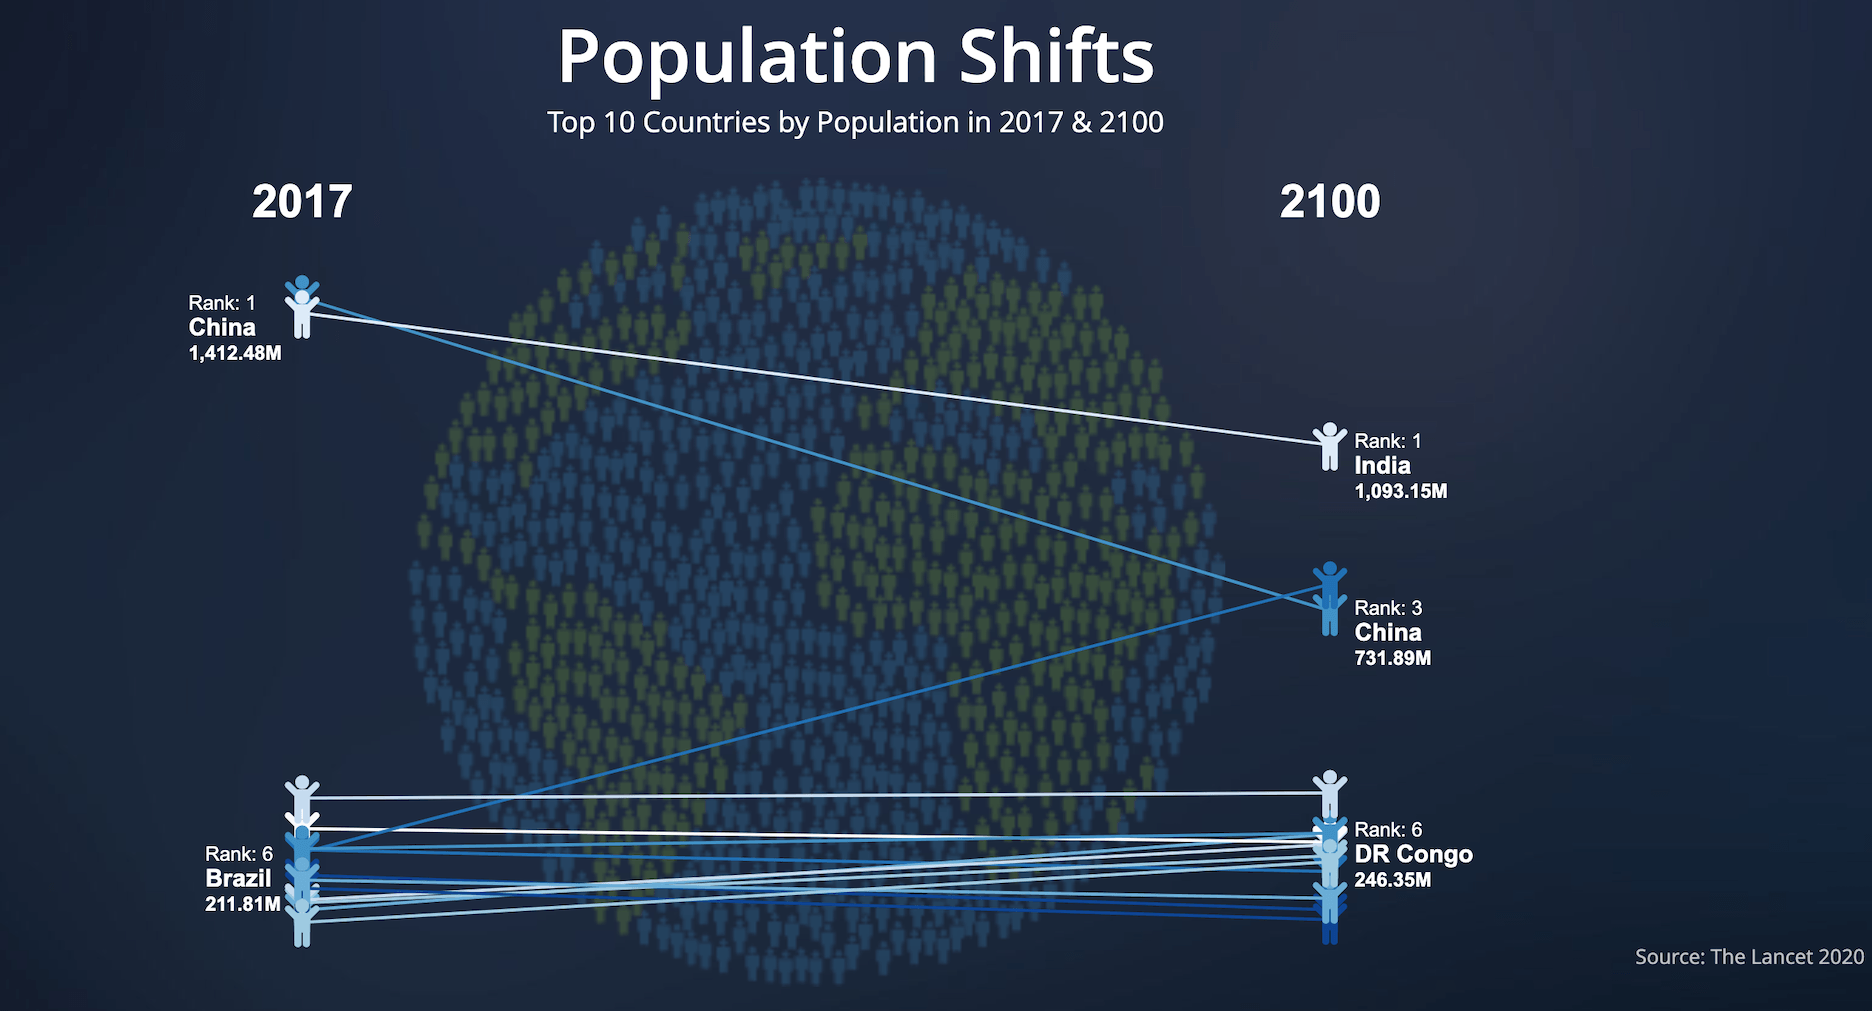
Charts Used: Vitara Slope Chart
Data Source: Lancet Study
Strategy Features
Vitaracharts is now FREE for Desktop and Workstation.
Please contact sales@vitaracharts.com to get a 30-day trial key.
Take note that this visual is a part of the VitaraCharts library.
Download visualizations: www.vitaracharts.com
Online interactive visualizations can be accessed here: https://cloud.vitaracharts.com
Publisher: Vitara
Vitara is a Strategy technology partner with its flagship product Vitaracharts - a visualization library add-on with 30+ new chart options for Strategy Desktop, Web, Mobile, and Library. For more details and a free 30-day trial, reach www.Vitaracharts.com.