Starting with the release of Strategy ONE (March 2024), dossiers are also known as dashboards.
Thinking of moving? Check out our dashboard, built with MicroStrategy and Vitaracharts, which shows purchasing parity across US states. Using the custom visualizations, figure out the most affordable states to live in the US 2008-2018.
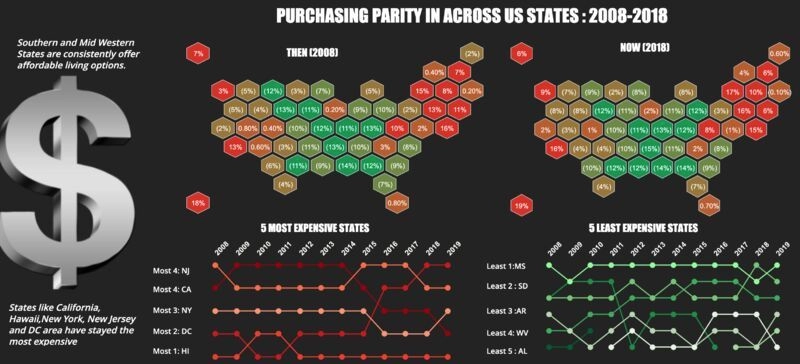
Data Source: U.S. Bureau of Economic Analysis
Charts Used: US Tile Map and Slope or Bump Chart from Vitara
Strategy Features
Vitaracharts is now FREE for Desktop and Workstation.
Please contact sales@vitaracharts.com to get a 30-day trial key.
Take note that this visual is a part of the VitaraCharts library.
Download visualizations: www.vitaracharts.com
Online interactive visualizations can be accessed here: https://cloud.vitaracharts.com
Publisher: Vitara
Vitara is a Strategy technology partner with its flagship product Vitaracharts - a visualization library add-on with 30+ new chart options for Strategy Desktop, Web, Mobile, and Library. For more details and a free 30-day trial, reach www.Vitaracharts.com.