Starting with the release of Strategy ONE (March 2024), dossiers are also known as dashboards.
New Features & Functionality
Sentiment Analysis with Strategy & R
Off-the-Shelf R Script allows anyone to add Sentiment Analysis to a Strategy Report, Document, Dashboard or Dossier.
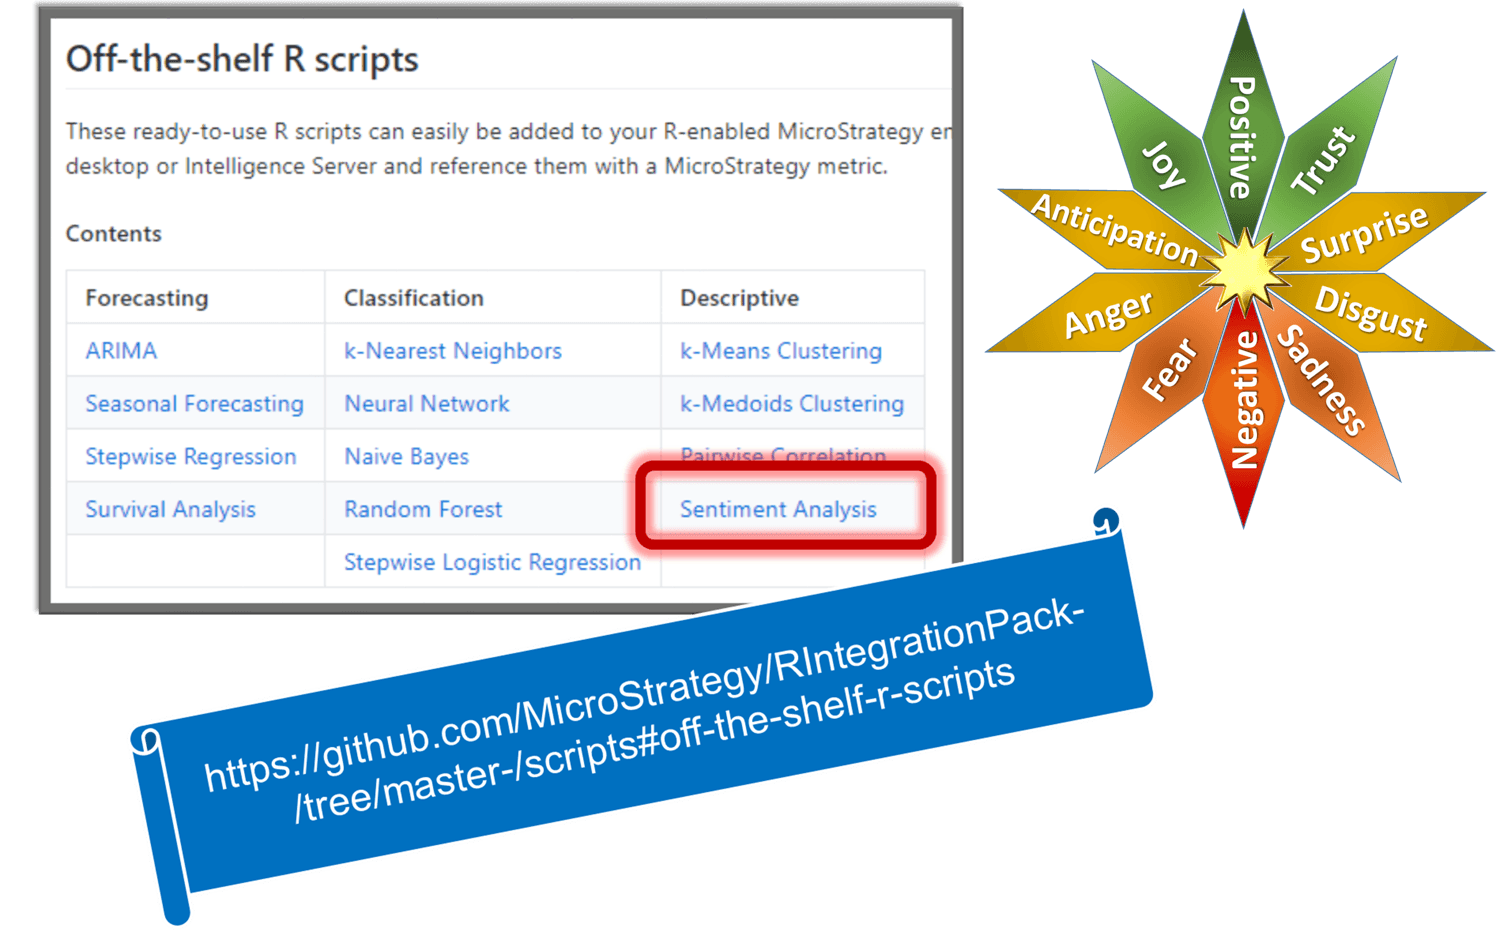
Released at Strategy World 2018, this 13th Off-the-Shelf R Script allows text to be analyzed for sentiments.
Sentiment analysis aims to measure the attitude of a writer’s words within a given text. It is an application of text mining and is used to extract sentiment from social media sources such as survey results, Twitter tweets, and Facebook comments. This analytic uses R’s tidytext package to analyze text for sentiment by associating each word with classifications from two lexicons and returns the sentiment analyses as 14 different results. Each result can be represented by a Strategy metric. In addition to these results which are returned “in-band” to Strategy metrics in a report, dashboard, document or dossier, this analytic optionally can persist results “out-of-band” to the file system, including a result table as a comma-separated-value file, a word cloud and a sentiment score histogram.
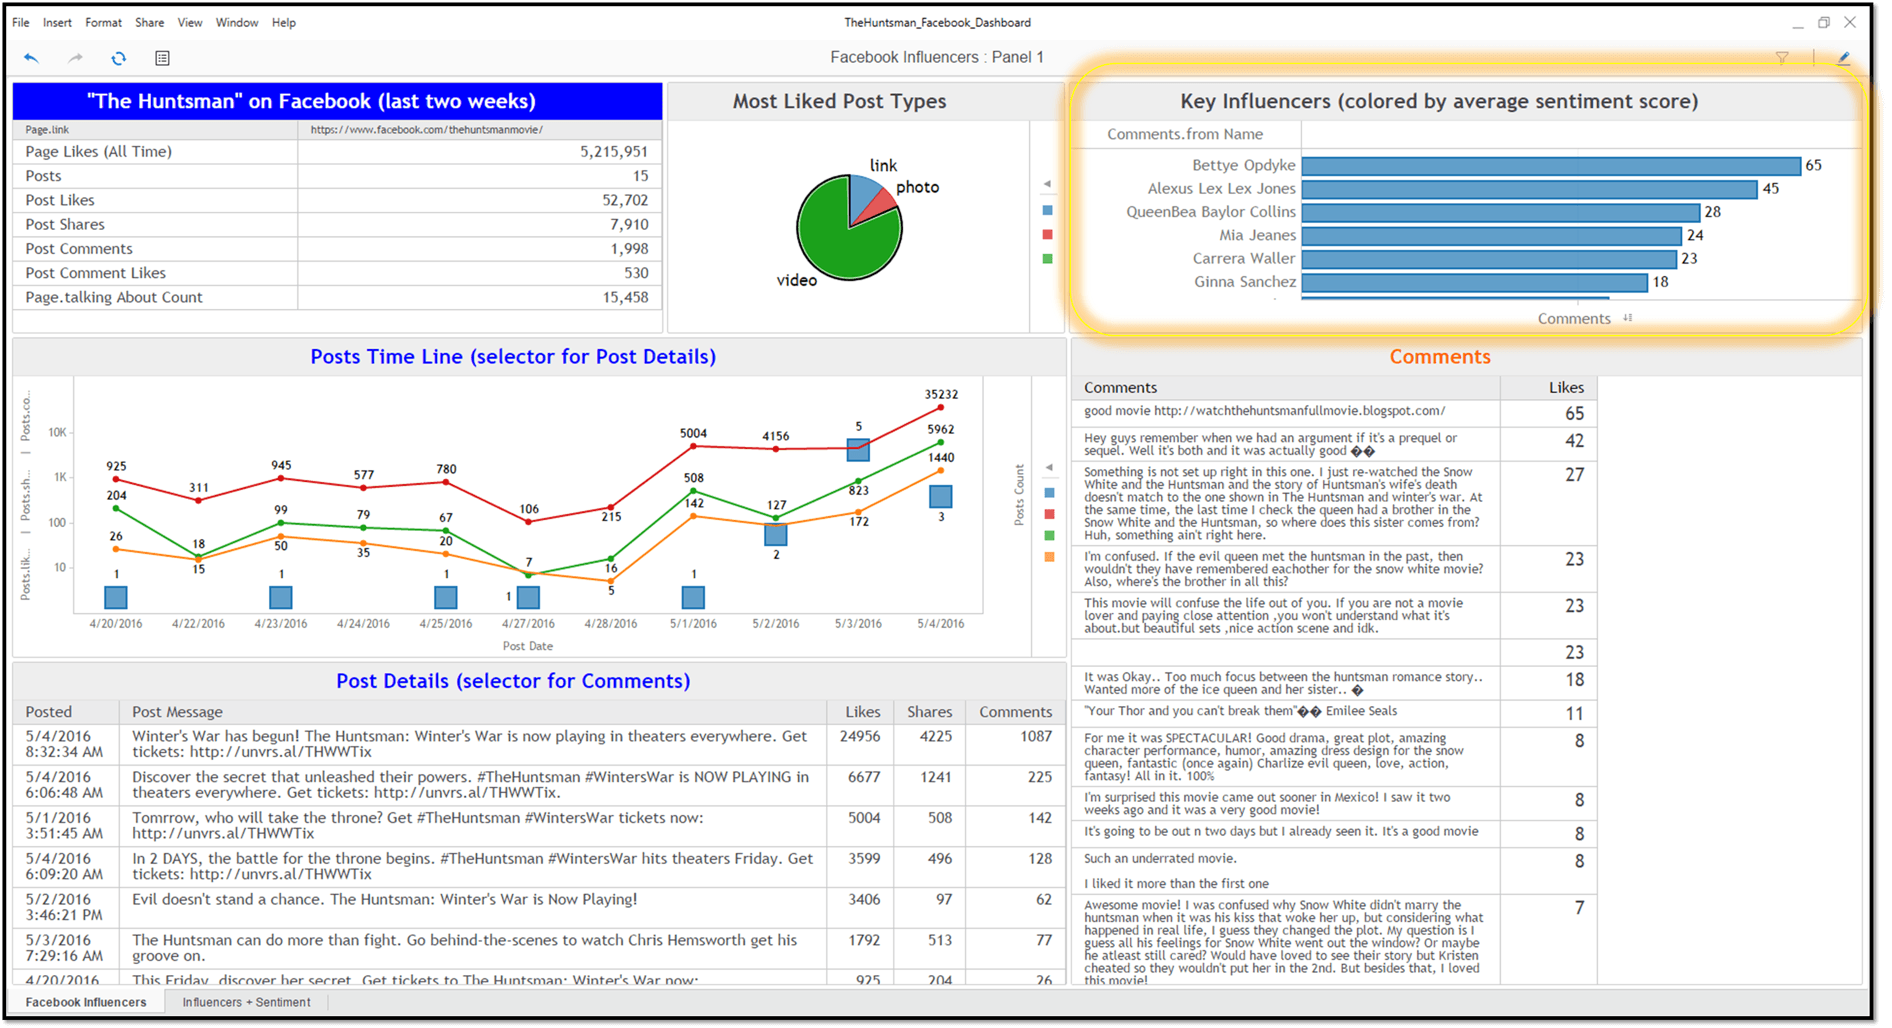
For example, here’s a Social Media Analysis that highlights the Key Influencers, those who comment the most when posts are made to a Facebook page:
Here’s the same page with those comments are scored for Sentiment:
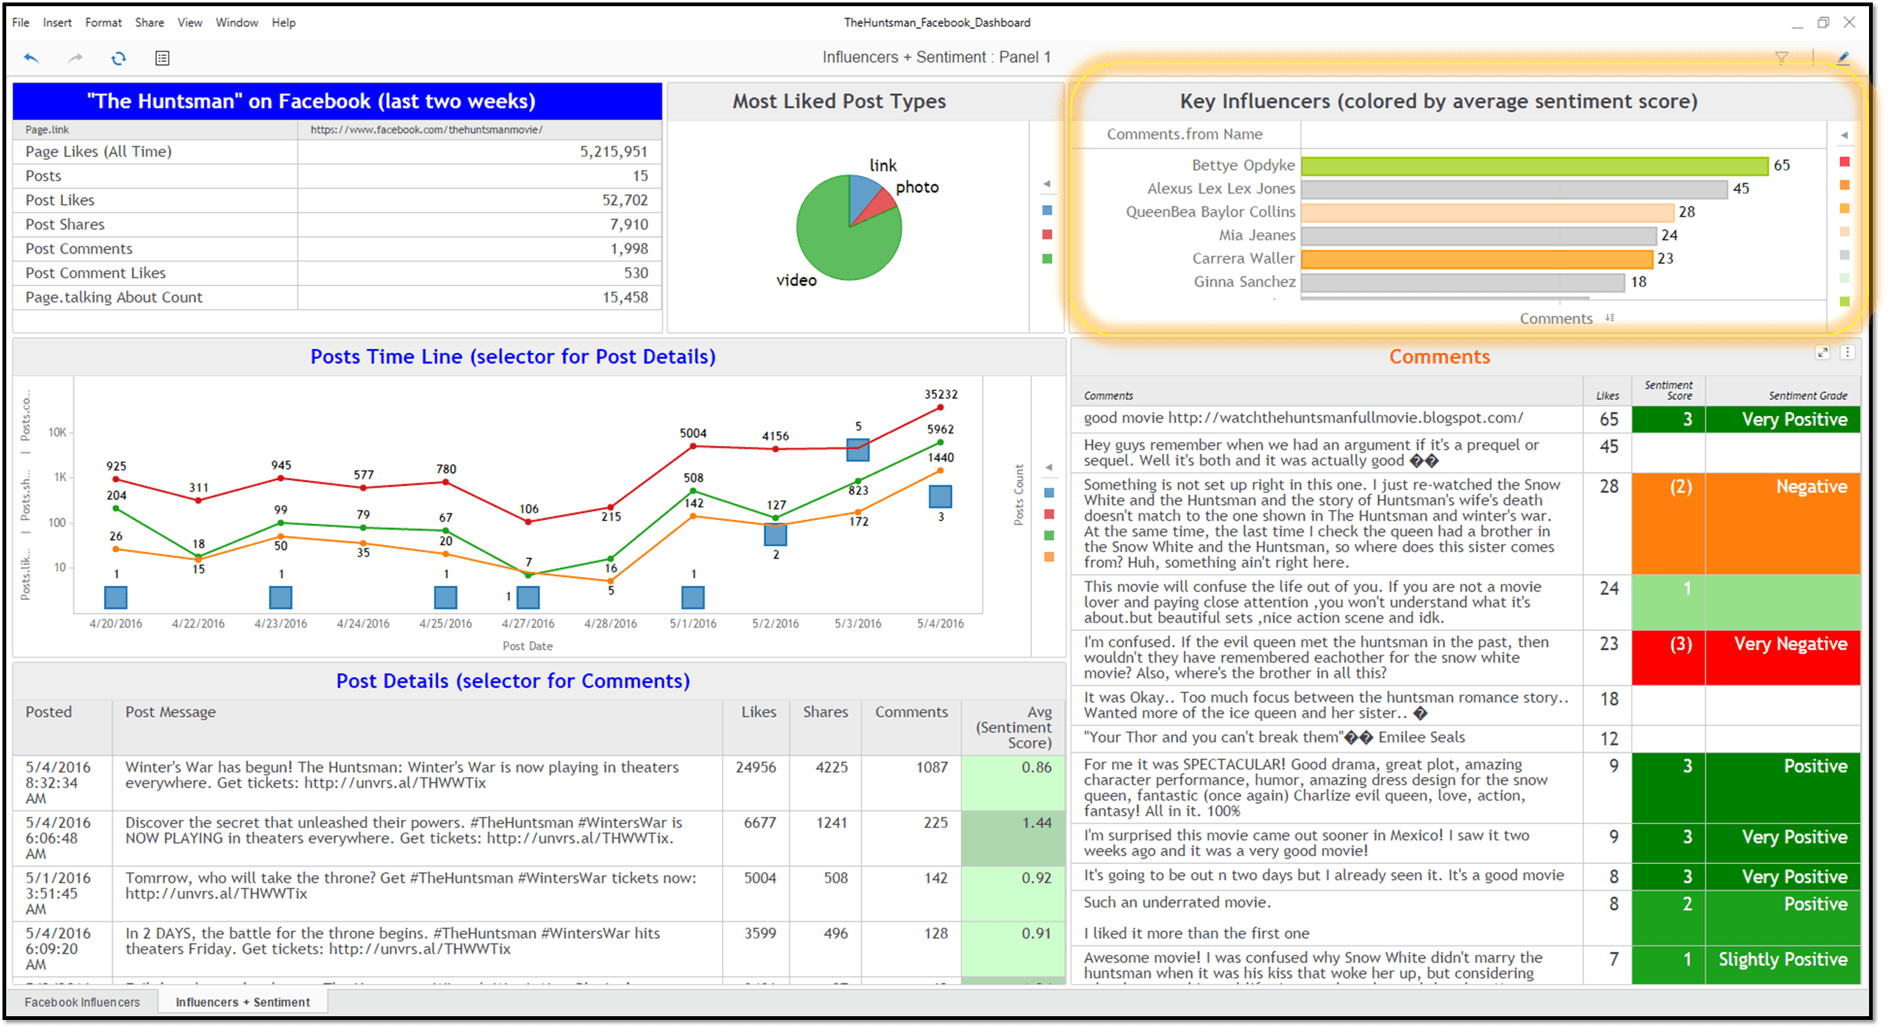
Now, with Sentiment Analysis, in addition to identifying the key influencers, it’s easy to see whether that influence tends to be positive or negative. Each comment is scored (lower right) on a scale from +5 (Extremely Positive) to -5 (Extremely Negative). Those scores are aggregated to show the average sentiments by User (upper right) and by Post (lower left).
Get started with these next few steps
RScript<_RScriptFile="SentimentAnalysis.R", _InputNames=" Text ", _Params="FileName='SA_mstr', PlotWordCloud=TRUE, PlotHistogram=TRUE, RemoveRetweets=TRUE, SaveCSV=TRUE">( Text )
If your metric is named different, say “MyText”, just replace “Text” with its name:
RScript<_RScriptFile="SentimentAnalysis.R", _InputNames=" MyText ", _Params="FileName='SA_mstr', PlotWordCloud=TRUE, PlotHistogram=TRUE, RemoveRetweets=TRUE, SaveCSV=TRUE">( MyText )
Metrics always have a Level and an Aggregation function, which allows a metric to deliver the correct results, even when used at different levels of aggregation. This is a key feature of the Strategy Query and Analytical Engines. Attributes don’t include this flexibility in dimensionality.
If “MyText” is an Attribute, it’s simple to convert it to a metric, by simply wrapping it in an aggregation function and giving it a Level:
RScript<_RScriptFile="SentimentAnalysis.R", _InputNames="MyText", _Params="FileName='SA_mstr', PlotWordCloud=TRUE, PlotHistogram=TRUE, RemoveRetweets=TRUE, SaveCSV=TRUE">(Max(MyText){~})
The script includes a demo that performs Sentiment Analysis on Lincoln's Gettysburg Address. See it in action with this How-To video:
http://tinyurl.com/MSTR-SA
Enjoy!