Starting with the release of Strategy ONE (March 2024), dossiers are also known as dashboards.
Starting in Strategy 2021 Update 1, there is an new out-of-the-box, feature-rich, Sankey visualization . We highly recommend using this visualization instead. Starting in 2021 Update 5, the Sankey visualization is located in the More section of the Visualization Gallery, instead of the Custom section.
Sankey diagram custom Visualization.
This visualization draws sankey diagram with each level of attributes and one metric . It's different than a Google sankey diagram which requires parent-child attribute. This Visualization requires more than 2 attributes and 1 metrics.
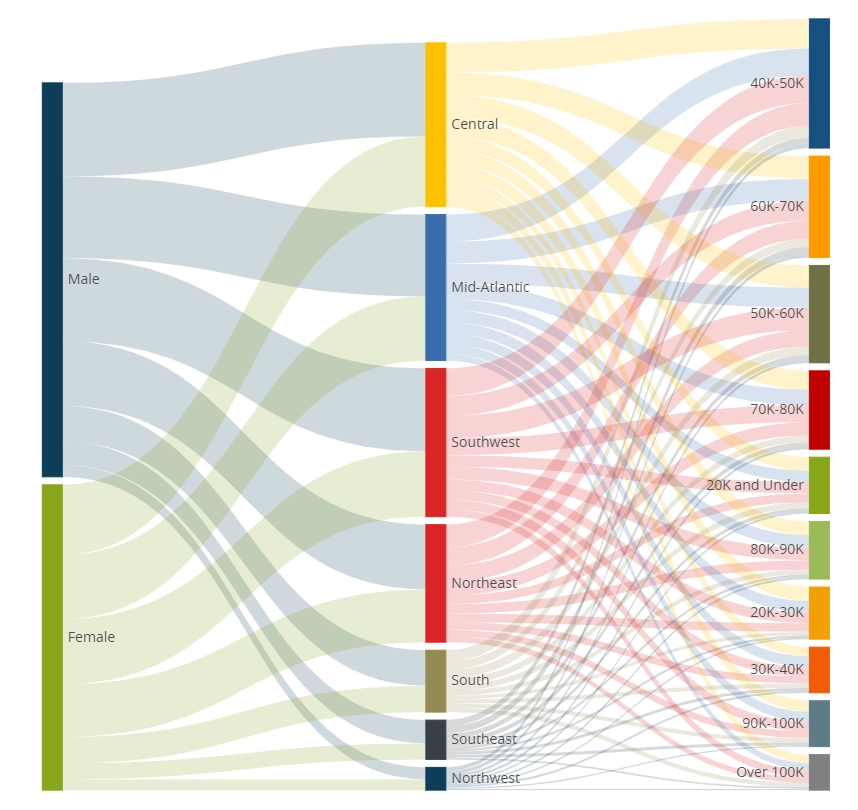
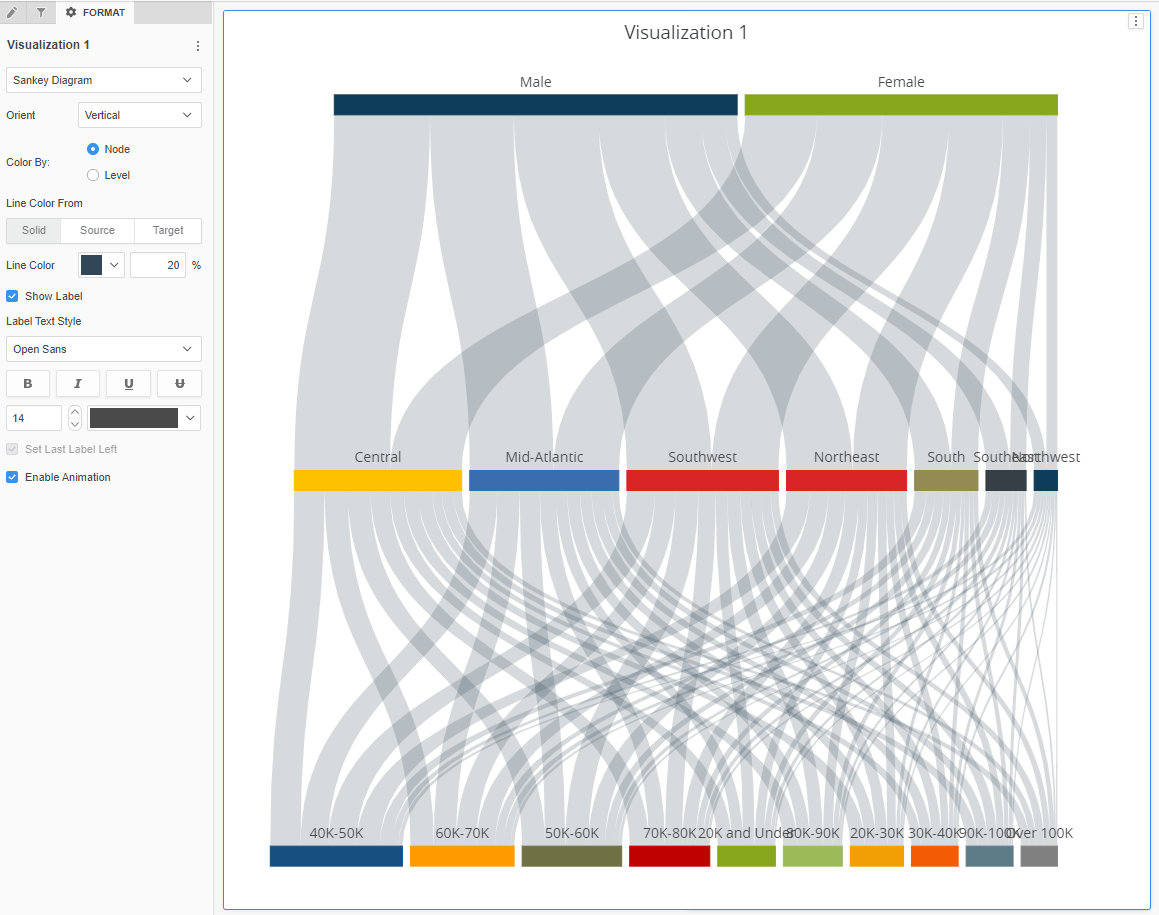
You can set the direction of the Sankey diagram and color of the nodes and lines.
When you set orient to vertical , It will draw the sankey diagram from the top.
Also you can set color of each node by level or node, you can set color of line by source , target or solid. Line color is applied when you set "Line Color From" to "solid".
Color scheme of node and line is decided based on palette of Dossier.
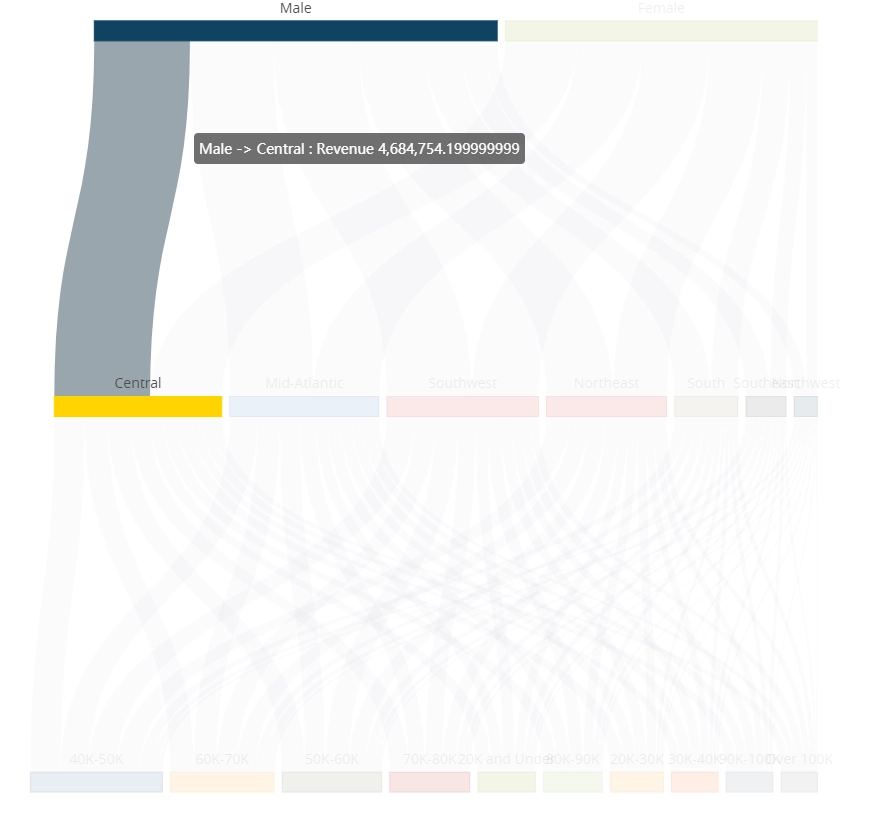
Caution : Metric is aggregated in the client side using sum to calculate line and node size. So the value of each line may not be correct when you are using non- aggregatable metric like profit% or distinct count metric.
Watch a quick tutorial video on importing custom visualizations in Workstation.
Strategy Version
* Tested on version m2020 and m2019 (2019 version is not support target different page feature)
Strategy feature
* PDF Export
* Set Target Visualization
* Set Target Page & Dossier (Only on Web)
Publisher: DongHyub Lee (Sales Engineer in Strategy Korea)
Visualization Disclaimer
By downloading or using this visualization, you accept and acknowledge these terms.
This visualization is both intended as sample code and provided as a convenience to Strategy users. Strategy cannot guarantee that the code provided will apply to any Strategy releases and clients outside of the versions stated within this article. This sample is supported by Strategy Technical Support up to and including the basic visualization functionality listed in this article. Defects will be triaged by the Strategy team as they are raised. For users with active Strategy Technical Support contracts, contact Strategy Technical Support to raise these defects.