Starting with the release of Strategy ONE (March 2024), dossiers are also known as dashboards.
Scatter plots, also known as scatter graphs, are types of mathematical diagrams that uses cartesian coordinates. This kind of plot can help you identify the relationship that exists between different values. Scatter plots and Bubble Charts are a great way to display a large number of related data. Users can add a field to the color by and size by box in the editor to make visual analysis much easier.
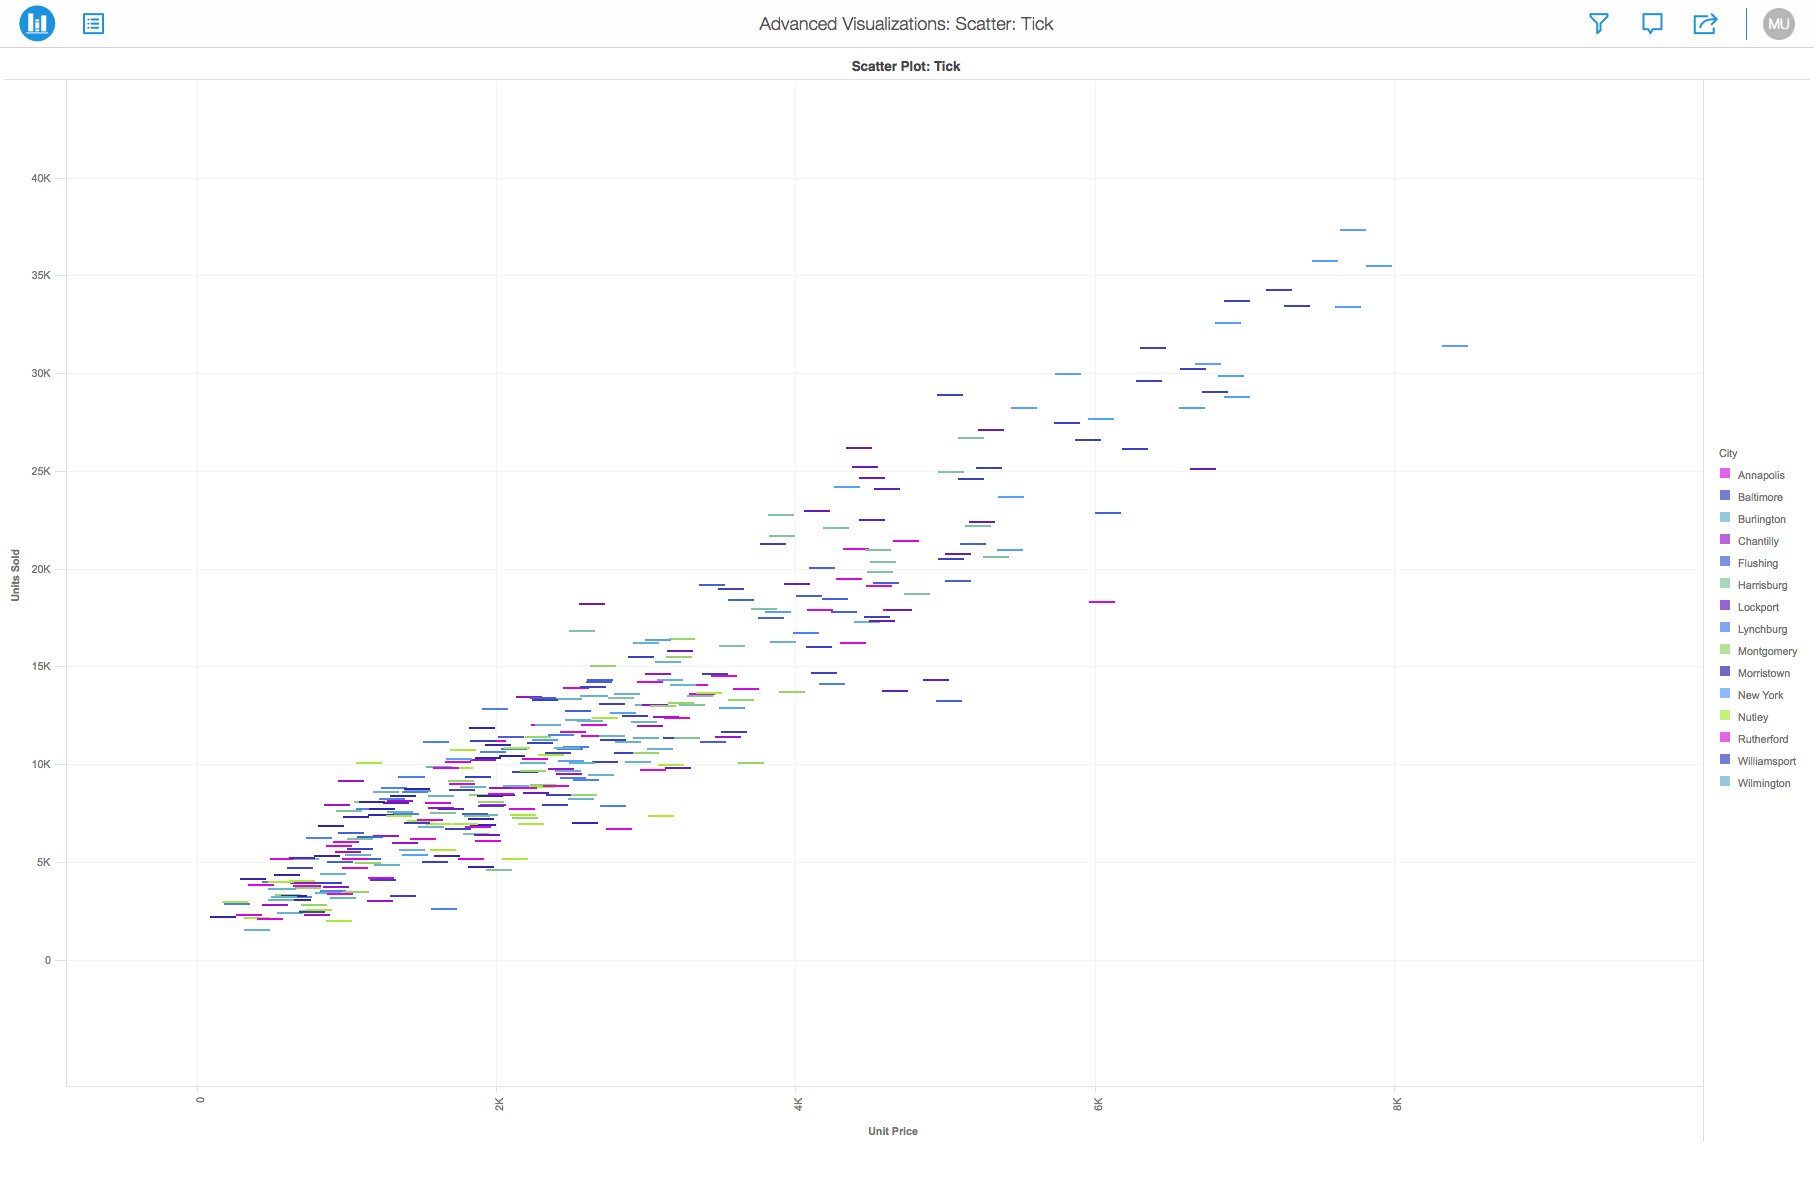
There are multiple different types of scatter plots; this article will review the "Tick" data marker option.
Type: Tick
Scatter plots can use various symbols like "ticks" to visualize data. These symbols represent three dimensions of data. Every object with its triplet (v1, v2, v3) of related data is plotted as a circle that expresses two of the vi values through the disk's xy location and the third through its size.
View the following image for a preview of the tick scatter plot:
Minimum Strategy version: 10.2
Publisher: Strategy
To view this dossier with the visualization:
Analyze data using scatter plots by downloading MicroStrategy Desktop!
A project in beta by ferdio, (2017, December 4th). Retrieved from http://datavizproject.com/
Interested in learning more about Dossier authoring? Visit the Learning Center on Community!
