Take an interactive look at hierarchical data represented as multi-colored concentric circles. Each level of the hierarchy is represented by one ring, or circle, with the innermost circle as the top of the hierarchy. The circle in the center represents the root node, with the hierarchy moving outward from the center. A segment of the inner circle bears a hierarchical relationship to those segments of the outer circle that lie within the angular sweep of the parent segment.
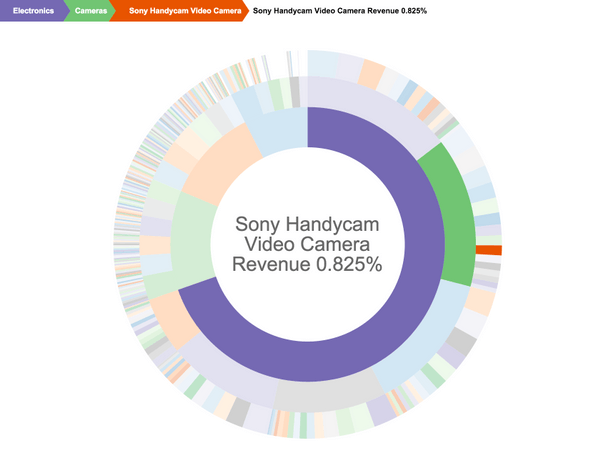
Sequences Sunburst charts are most effective at showing how one ring is broken into its contributing pieces. One use case is to summarize navigation paths through a web site. The visualization makes it easy to understand visits that start directly on a product page compared to visits where users arrive on the site's home page and navigate from there.
View the following image for reference:
Object requirements:
Minimum Strategy version: 10.2
Current visualization version: 1.0
Publisher: Strategy
To install this visualization:
By downloading or using this visualization, you accept and acknowledge these terms.
This visualization is both intended as sample code and provided as a convenience to Strategy users. Strategy cannot guarantee that the code provided will apply to any Strategy releases and clients outside of the versions stated within this article. This sample is supported by Strategy Technical Support up to and including the basic visualization functionality listed in this article. Defects will be triaged by the Strategy team as they are raised. For users with active Strategy Technical Support contracts, contact Strategy Technical Support to raise these defects.
Anyone seeking to use this visualization is encouraged to review and adapt this sample based on user requirements. Contact Strategy Professional Services for assistance with these same adaptations. If users would like to provide feedback on or recommendations for this visualization, post in the comments section of this article.