Starting with the release of Strategy ONE (March 2024), dossiers are also known as dashboards.
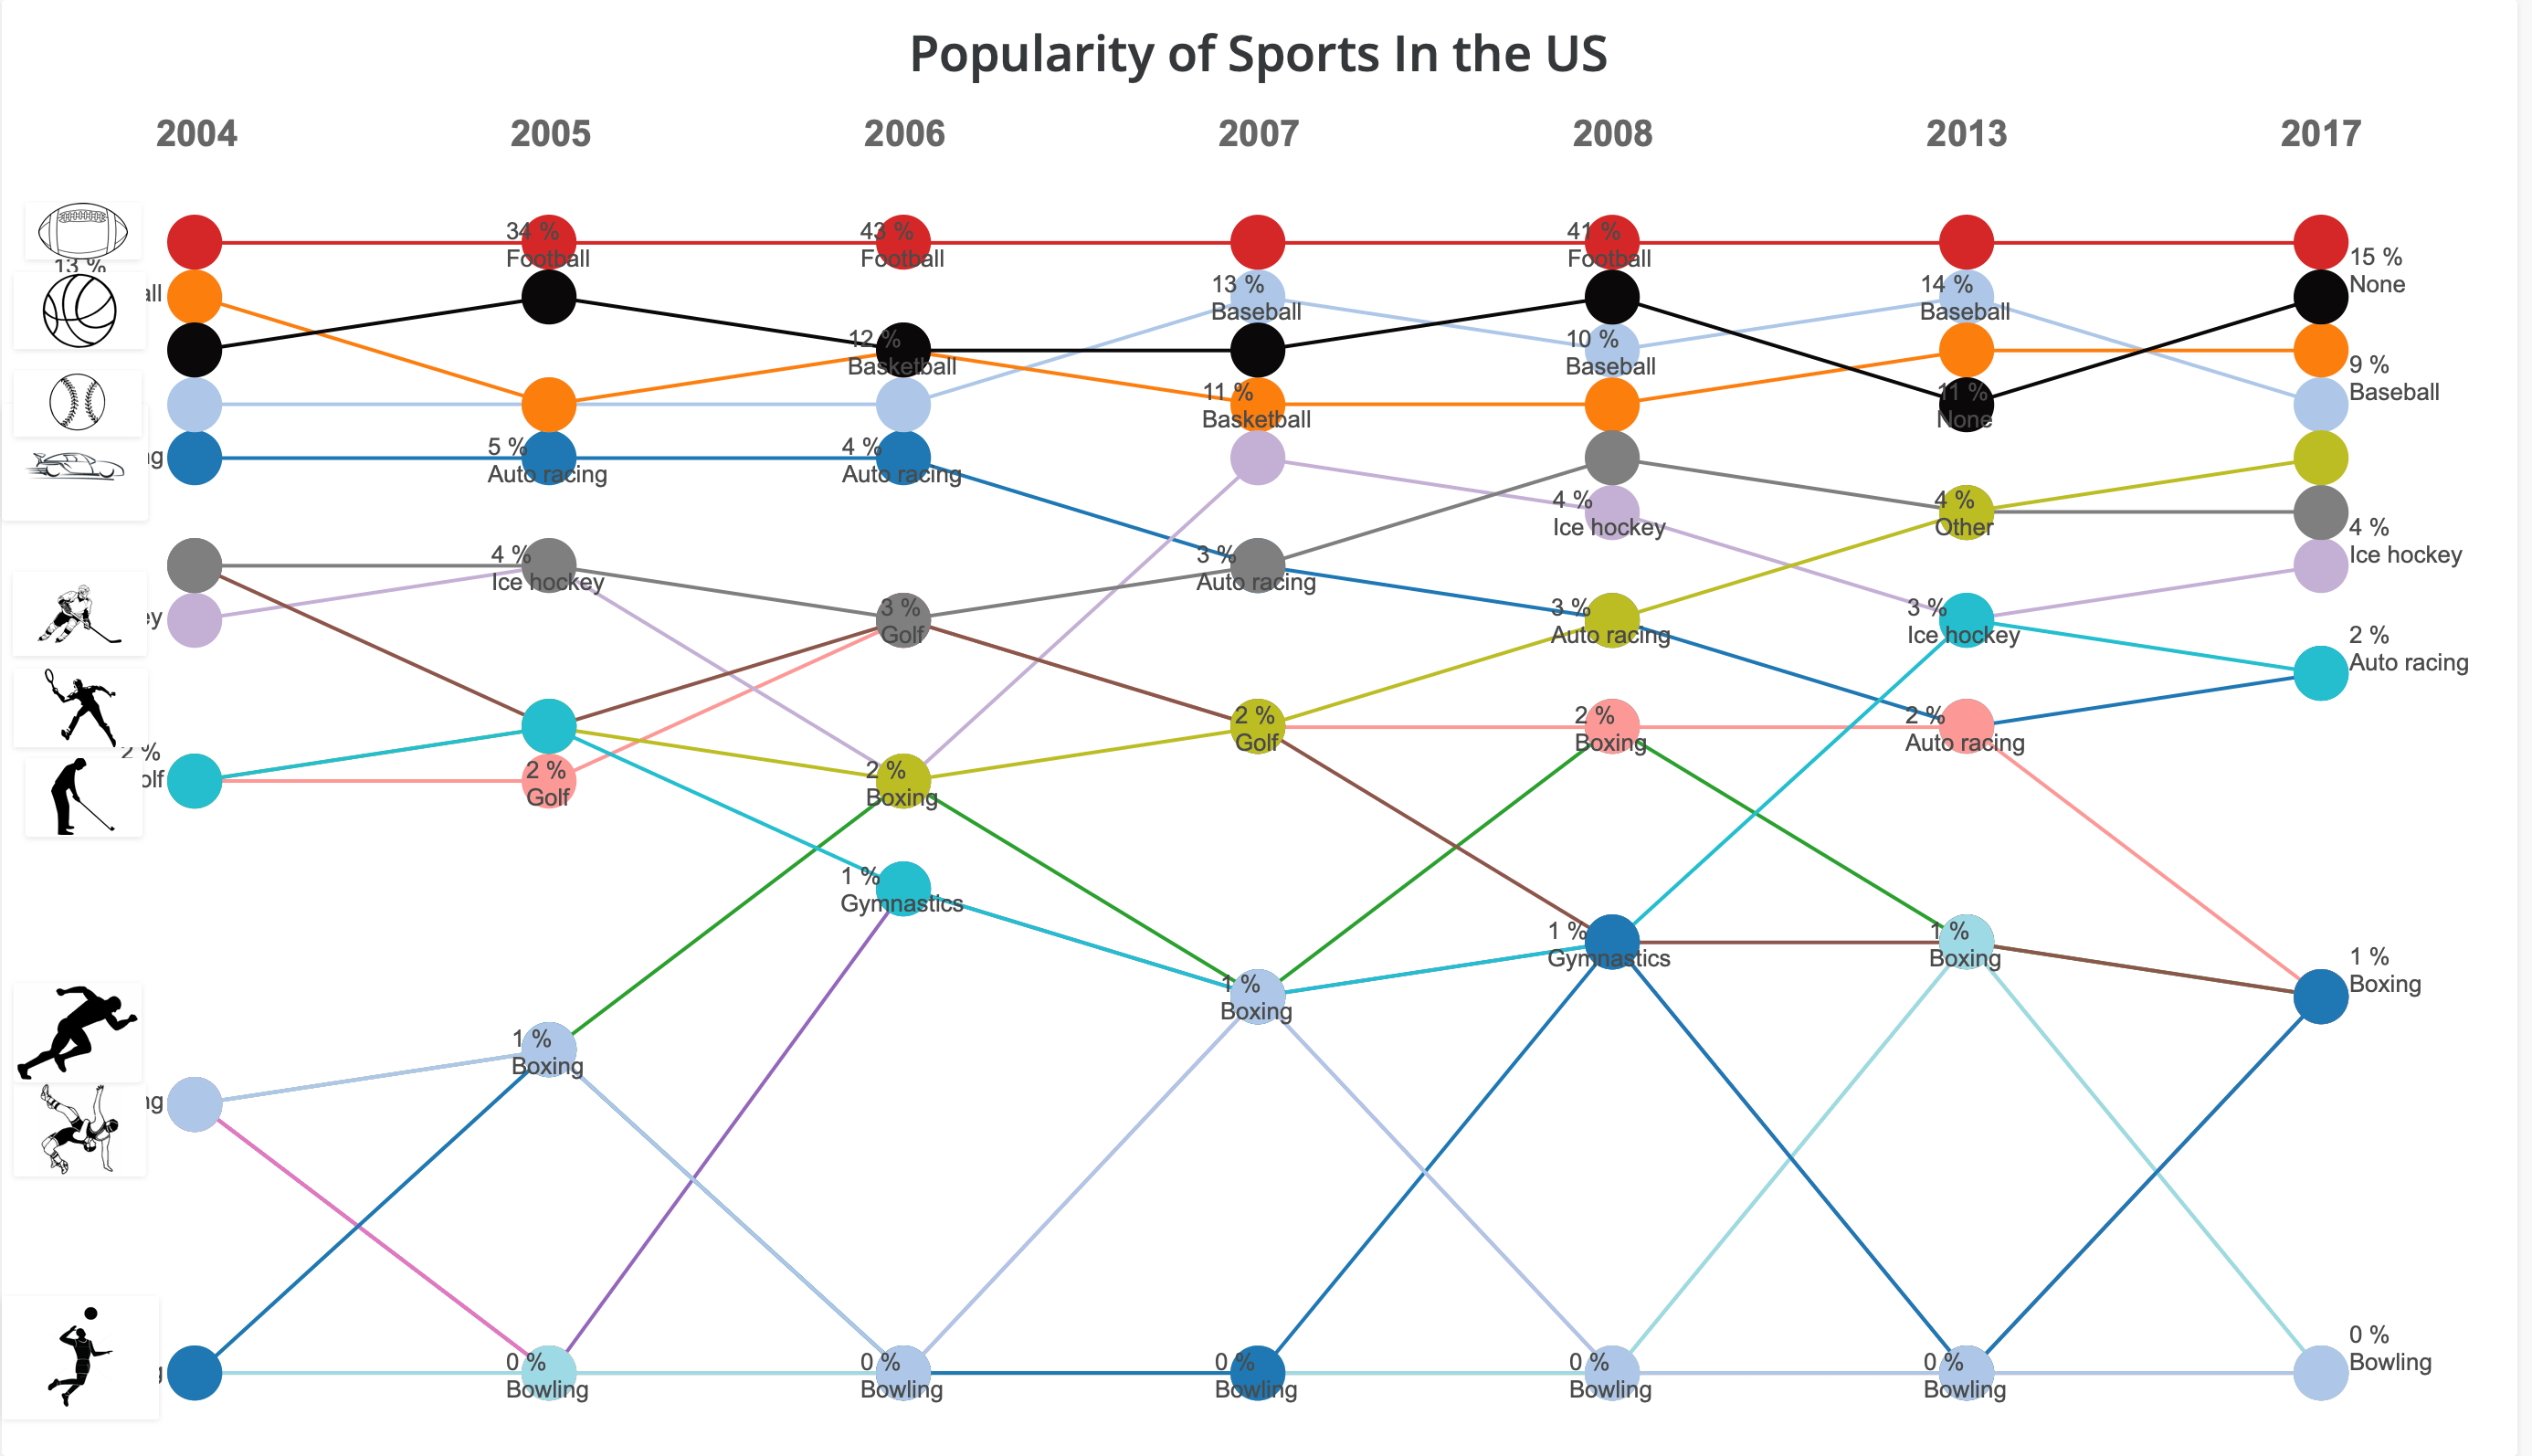
Over the years American Football continues to reign TV viewership with over a third of the viewers picking it as the favorite sport to watch. Baseball and Basketball are jostling for 2nd and 3rd position with viewers voting in 11-15% preference for them while an equal (11-15% viewers) number prefer no sports.
The chart above shows the ebbs and flows of the popularity ranking from Gallup's survey of TV viewers in the US over the years.
Vitara's slope chart and Strategy 2020's overlay feature have been used to display this visualization.
Data Source: Makeover Monday Contest and Gallup
MicroStrategy Features
Vitaracharts is now FREE for Desktop and Workstation.
Please contact sales@vitaracharts.com to get a 30-day trial key.
Take note that this visual is a part of the VitaraCharts library.
Download visualizations: www.vitaracharts.com
Online interactive visualizations can be accessed here: https://cloud.vitaracharts.com
Publisher: Vitara
Vitara is a Strategy technology partner and offers a fully supported, production-ready chart plugin (VitaraCharts) with 30+ stunning visualizations to enhance Strategy analytics. All Vitara visualizations are customizable and supported through upgrades for a hassle-free experience. We perform extensive testing for backward compatibility with all currently certified versions of Strategy and also ensure all new versions of Strategy are tested and supported across all charts.
For more details please contact sales@vitaracharts.com or www.vitaracharts.com.