Starting with the release of Strategy ONE (March 2024), dossiers are also known as dashboards.
This month, we will be taking a look at one of the most popular products in the world, coffee. This dossier analyzes global trade patterns of coffee, its historical rise, and the best places to drink it in the United States. This featured dossier also leverages several features that are brand new to Strategy 2020, including Free-Form Layouts and Compound Grids!
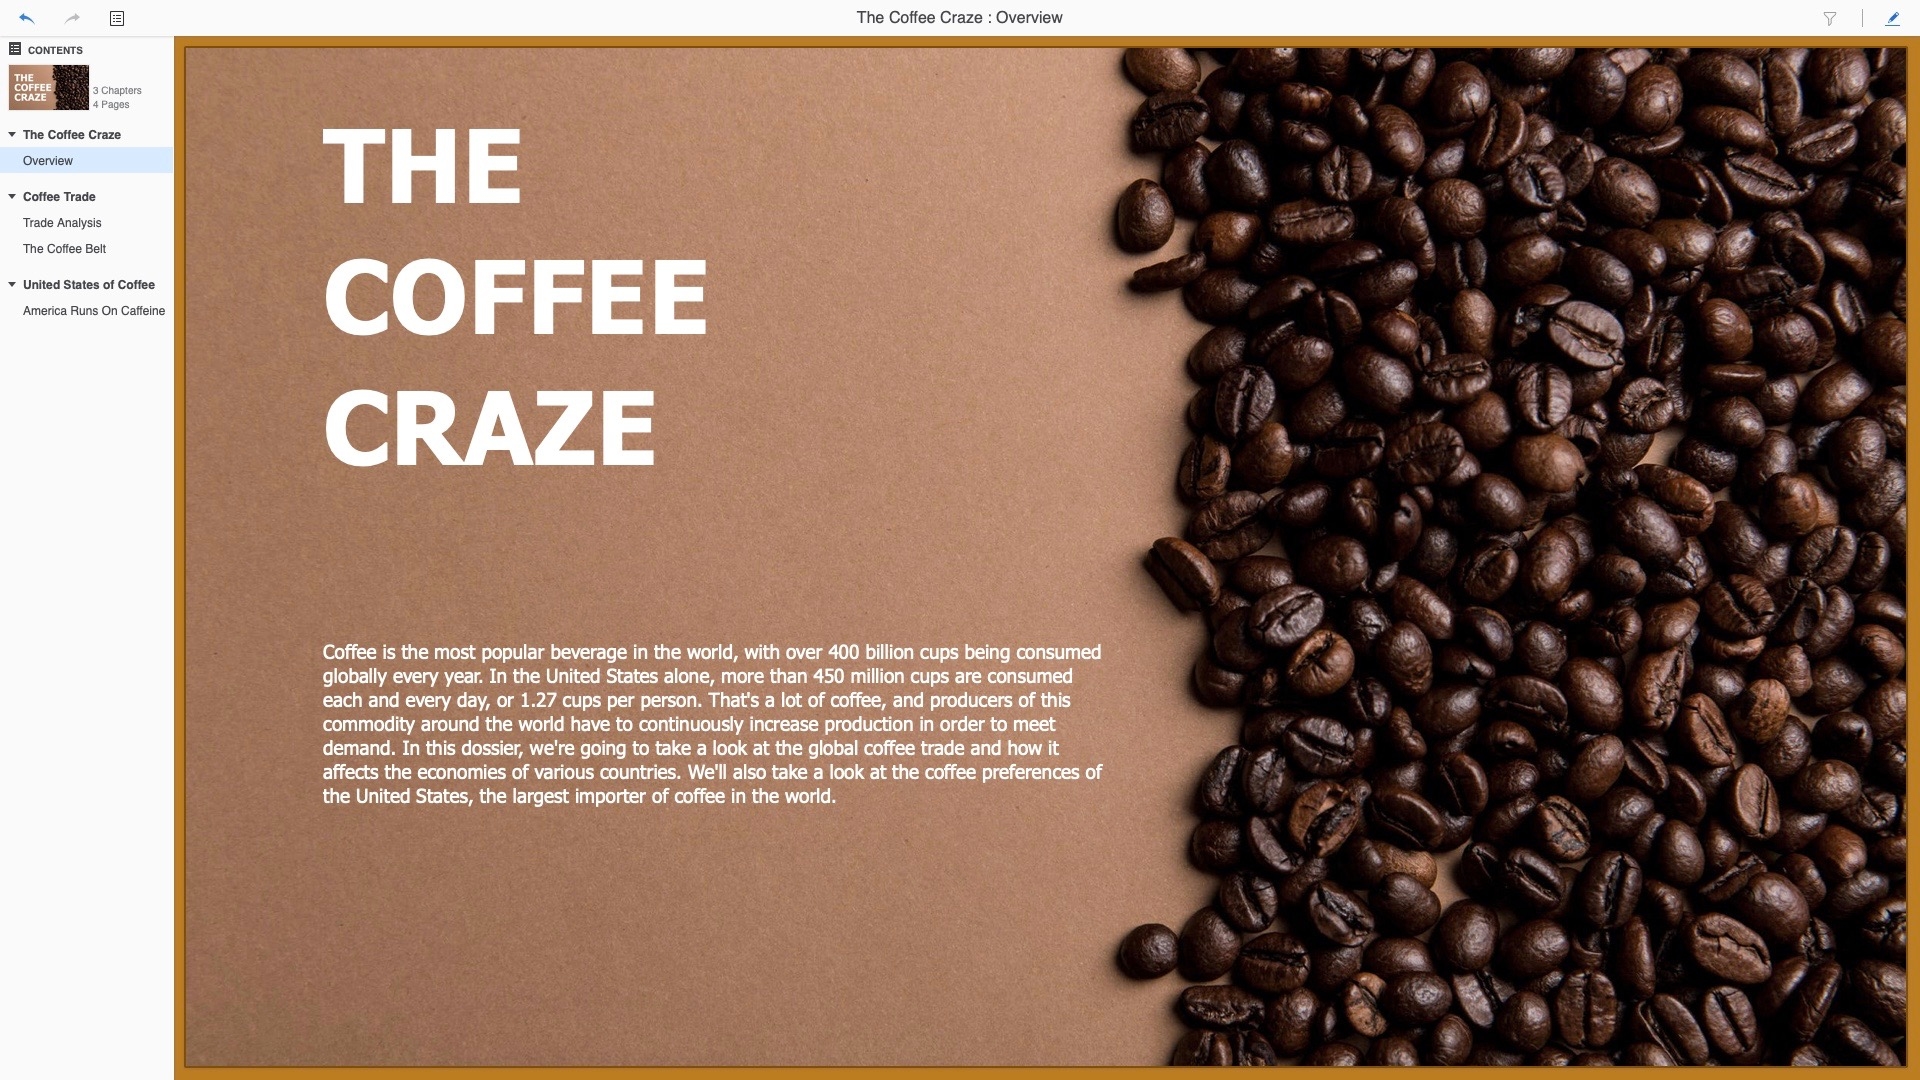
This month's dossier is intended as more of a consumer-facing report rather than being business-facing. This enabled us to utilize an introductory page, built using the Free-Form Layout feature, to assist in telling a full story with our dossier. The first chapter and page of this dossier is just that -- a place to introduce the topic, coffee, and to give background information as well as some fun facts. This frames the rest of the dossier and gives viewers a better idea of coffee’s importance on a global scale.
Moving into the second chapter of the dossier, the focus follows the introduction page and takes a look at the global coffee trade. There are certainly ebbs and flows to coffee production, as clearly shown in the KPIs at the top of the page. Domestic Consumption and Exportable Production are good indicators of how each country has fared over the last 30 years in the scope of the coffee industry. The Compound Grid below these KPIs helps to further show detailed metrics about coffee production, while the Bubble Chart provides a good way to make comparisons between coffee imports and exports of countries around the world.

The Coffee Belt is the name given to the world’s largest producers of coffee, which are all situated along the equator and give the appearance of a belt around the Earth. The second page in this chapter highlights this set of coffee-focused nations. Visualizing export data on the map shows us the clear image of The Coffee Belt and how it got its name. This page also allows us to highlight the abilities of Free-Form Layouts within dossier. We were able to layer our Ring Chart as a selector on top of both the map and a supporting KPI visualization, giving the page a more cohesive visual style and better utilization of space. In this instance, the Ring Chart and KPI would’ve taken up a significant amount of space on the same page in the traditional Auto Layout, but they provide great context to the map, and having the ability to layer them is crucial.

The U.S. is one of the largest consumers of coffee in the world. While it’s hard to find reliable statistics on coffee consumption in specific areas of the country, we can make educated inferences based on what data is available. First and foremost, analyzing Google search trends for the word “Coffee” confirm what is well known around the U.S.: Seattle is, indeed, the coffee capital of the country. What’s more interesting to see are the rest of the cities near the top of this list. Varying wildly in terms of states and geographical regions, this list gives us a good picture of how popular java is in different places. Starbucks and Dunkin Donuts are two of the most popular places to get coffee around the U.S. However, Starbucks is, by far, the preferred java house across most states in the country. Only in the Northeast region of America do coffee drinkers prefer the taste of Dunkin.

