In the rapidly changing landscape, successful business owners have learned to harness their financial data. Financial management and analysis reflect on income statements, balance sheets, and cash flows. A successful financial analysis goes beyond numbers, graphs, and charts. Modern financial analysis involve different techniques, tools, and processes compatible with the nature of your business.
The top-level management like CFOs’, VPs’, and Directors can take advantage of this solution for strategic planning, budgeting, and forecasting. This solution is empowered by financial dashboards which are designed to help you track all the relevant finance KPIs - in one consolidated view. This solution helps the finance departments to stay on top of the financial performance of the company. You can keep a close eye on all your financial operations in real-time and track important KPIs such as Bookings, Revenue, Expenses, GM%, Profit, Variance, and much more.
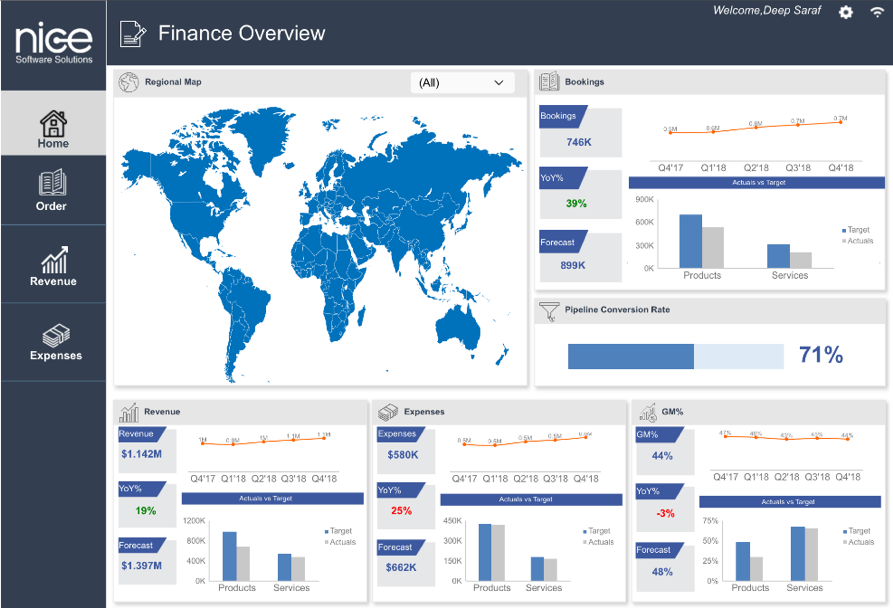
The Summary page gives a brief about the company’s performance in the current quarter. It gives a gist about the bookings company received, revenue generated, expenses incurred, and the GM%. The solution provides high level idea about company’s YOY growth. It also highlights the forecasted and actual numbers for the current quarter for quick comparison. The solution also provides a similar kind of analysis at the regional level. It facilitates quick navigation to see each of the KPI’s in detail.
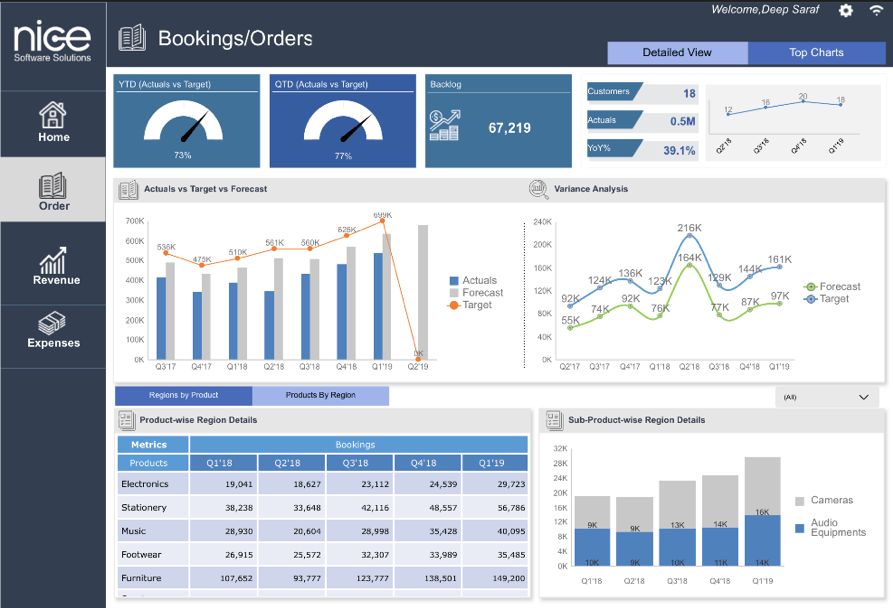
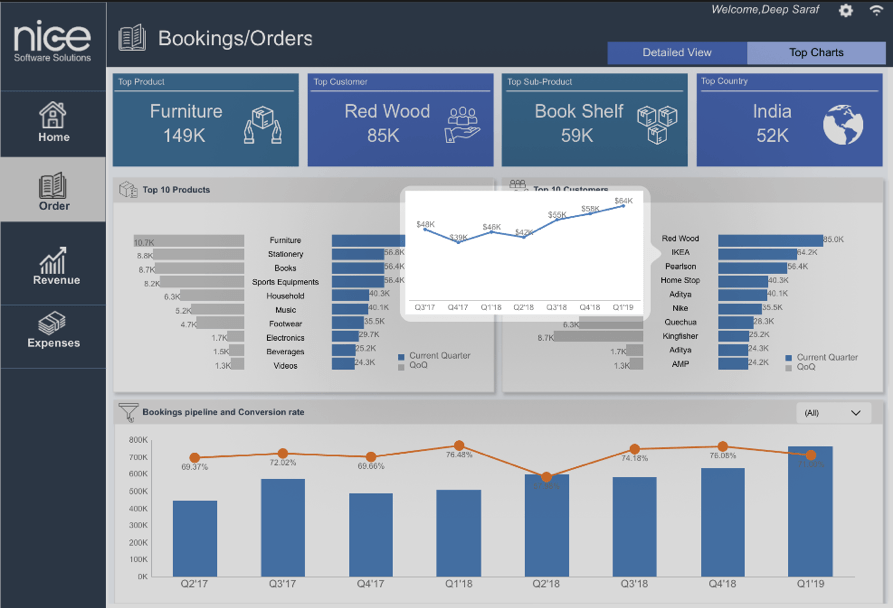
Any organization would like to track the amount of bookings it receives to assess the revenue expected. This solution highlights the top performer by Product, Customer, Sub-Product, and Region. The solution provides an at-a-glance view to the top 10 bookings by Product and Customer, along with the comparison to previous quarters. The conversion ratio trend gives the detail on how many potential pipelined bookings actually got converted
The solution also offers -
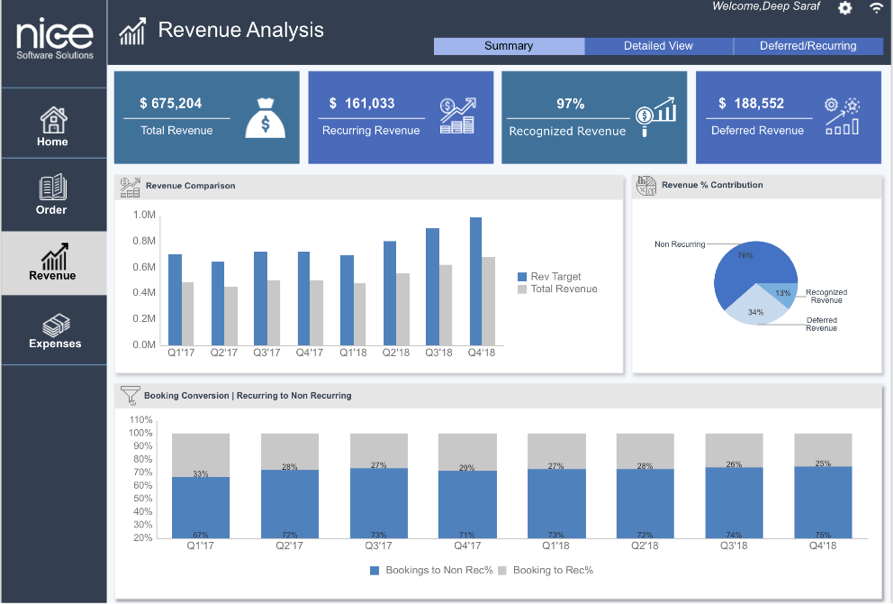
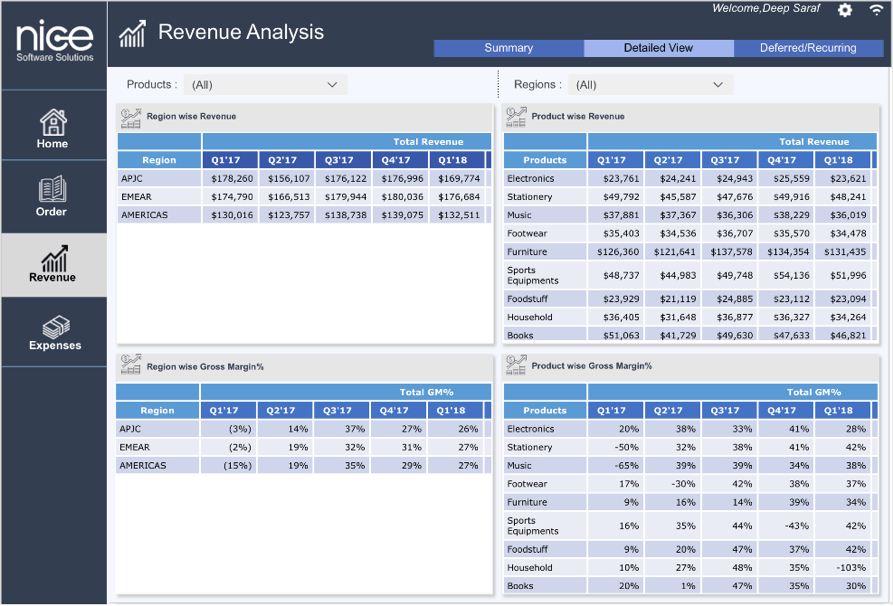
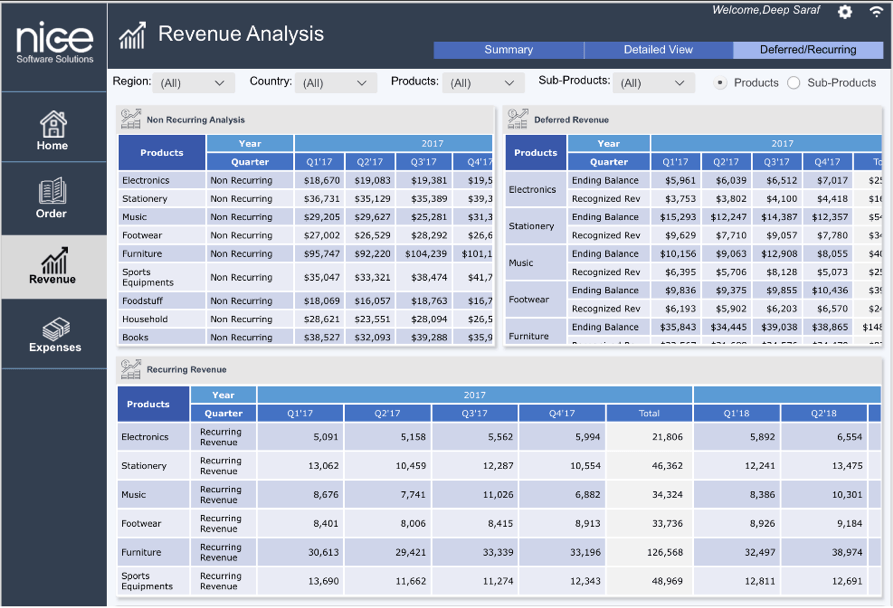
Revenue is a key variable for analysing business performance, generate profits and gross margin percent. The solution provides an at-a-glance view of company’s total revenue. It shows the contribution of total revenue by its type, Recurring, non-recurring and deferred. The trend of last 8 quarter to track the growth of the company at glance. The detailed views shows the regional level data for the revenue trends and its comparison.
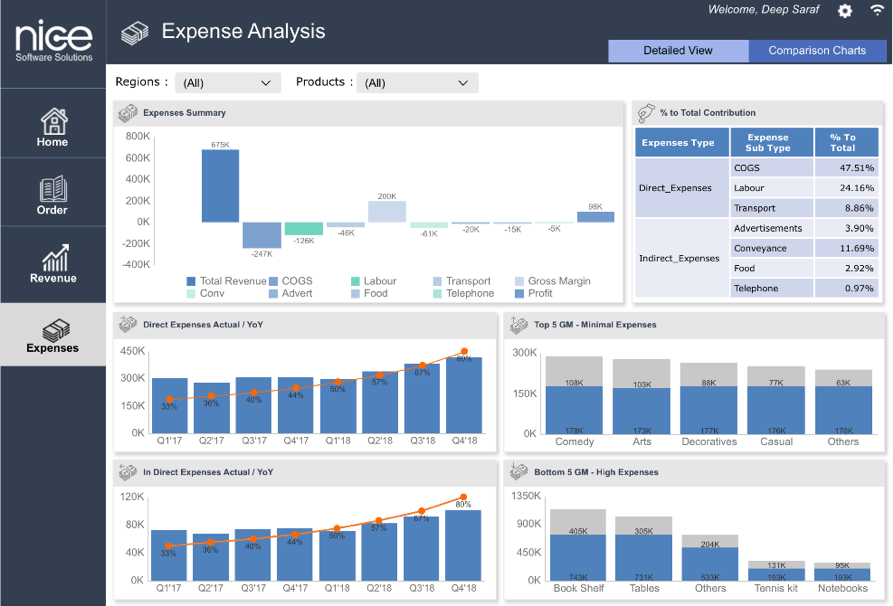
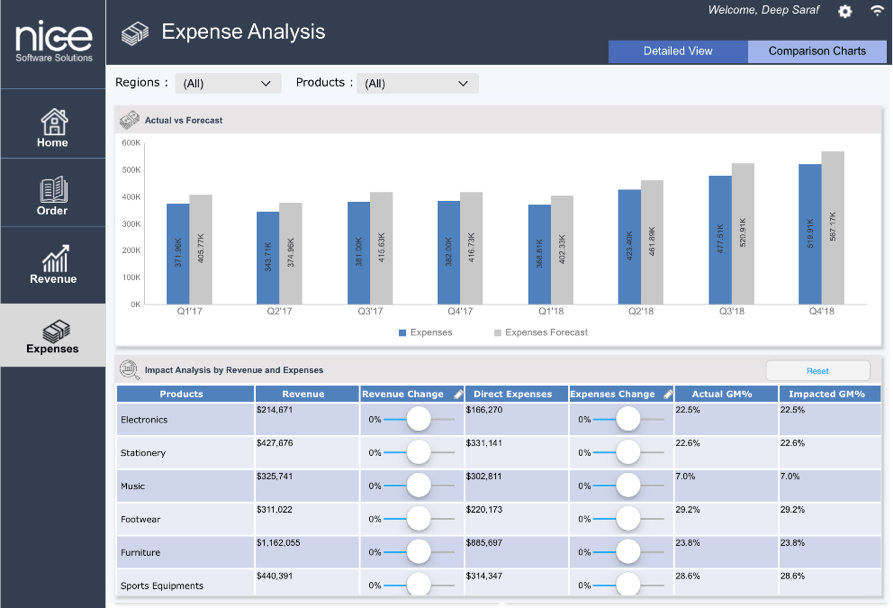
Companies can clearly assess their business through different expense types and their percent-to total contribution. The Expense summary shows a water fall model; it depicts the different direct and indirect expenses affecting the GM% and the Profit of the organization. Its shows the actual vs YOY growth for the direct expenses and Indirect expenses that the company bears. One of the important analyses shows the top Products with highest GM and low expense, as well as bottom products with low GM and high expenses. Trend shows the comparison between the actual expenses and forecasted expenses for the last 8 quarters. Impact analysis lets you assess the forecast and manipulate the numbers to analyze how you can achieve the set target for GM%.

www.nicesoftwaresolutions.com