Starting with the release of Strategy ONE (March 2024), dossiers are also known as dashboards.
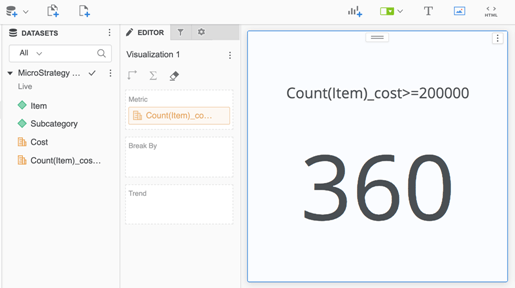
In some business cases, you may want to show only a metric value in a dossier visualization. When the metric contains a metric qualification condition and the data access mode of the dossier is a live connection, the metric value may not result as expected. This is due to the metric qualification being ignored.
The Strategy Tutorial project is used in the following example.
First, look at the query details of the KPI visualization by clicking on the More icon.
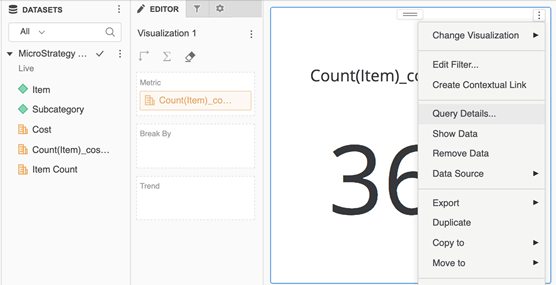
You can see the following:
*******************************************…Tables Accessed:lu_itemSQL Statements:Pass0 -select count(distinct a11.item_id) AS WJXBFS1from public.lu_item a11…*******************************************
The default output level is "None selected," which means the metric is being calculated at the report level, if any of the following are true:
If none of above criteria are met, then the metric's dimensionality is used.
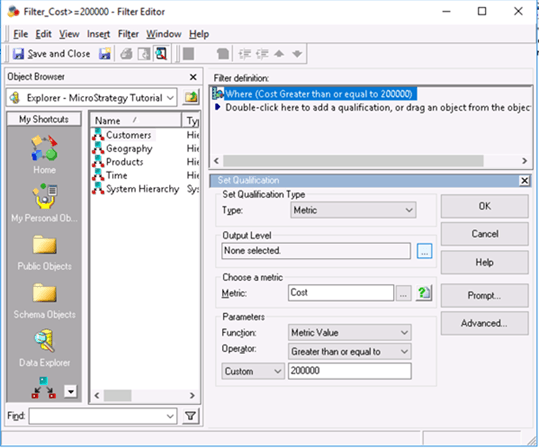
In our case, Cost's metric is set to the report level, so the output level of the metric qualification is the report level. In case of dossiers with live connection mode, the metric qualification is calculated at the dossier visualization level. Since no attributes are added to the visualization, the SQL engine is unable to figure out which level Cost is aggregated at. Thus, the metric qualification is ignored.
There are two ways to have the conditional metric return the desirable results.
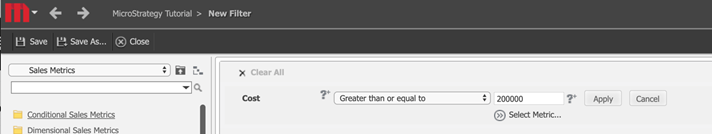
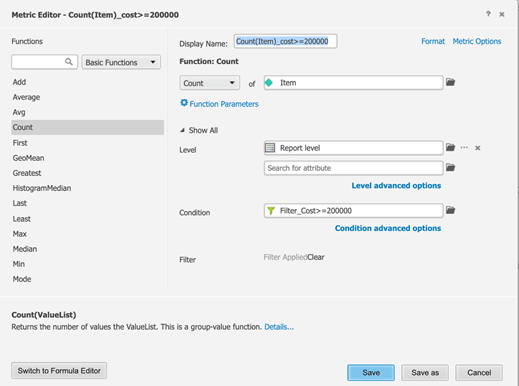
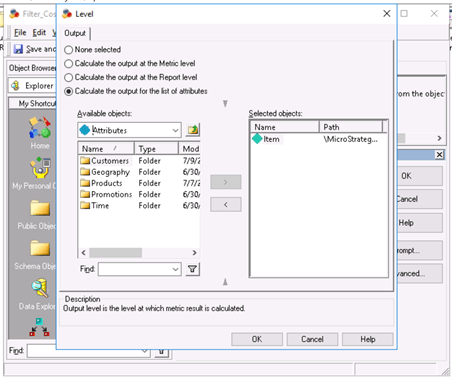
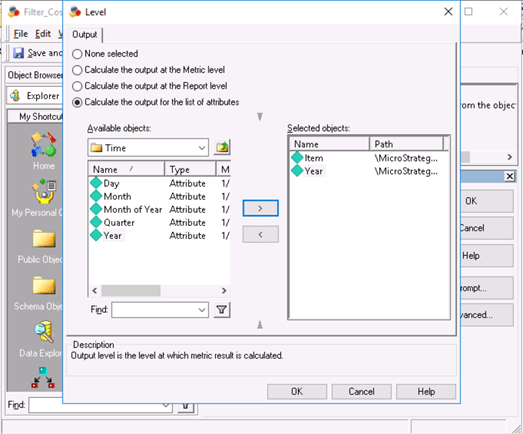
If you want to know how many items cost equal to or greater than 200,000, then set the output level to be Item.
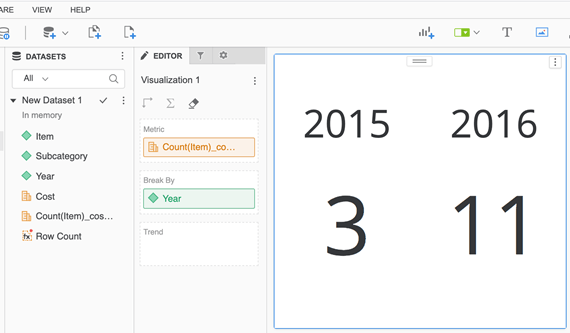
You can see the metric result in the dossier change to the expected value of 37.
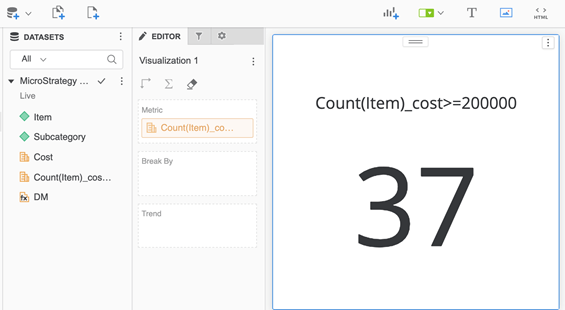
The query details show that the metric qualification is applied:
**********************************…Tables Accessed:lu_itemitem_mnth_slsSQL Statements:Pass0 -…CREATE UNLOGGED TABLE TUGE6T203MQ000( item_id INTEGER)Pass1 -…insert into TUGE6T203MQ000select a11.item_id AS item_idfrom public.item_mnth_sls a11group by a11.item_idhaving sum(a11.TOT_COST) >= 200000Pass2 -…select count(distinct a11.item_id) AS WJXBFS1from public.lu_item a11 join TUGE6T203MQ000 pa12 on (a11.item_id = pa12.item_id)…*****************************************
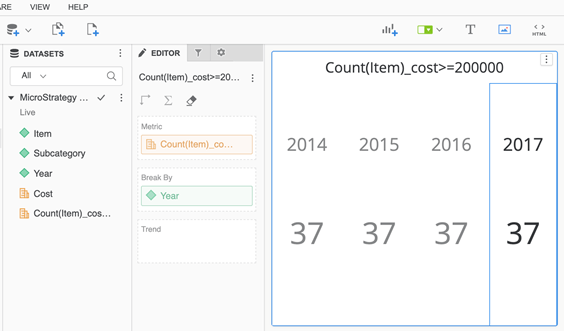
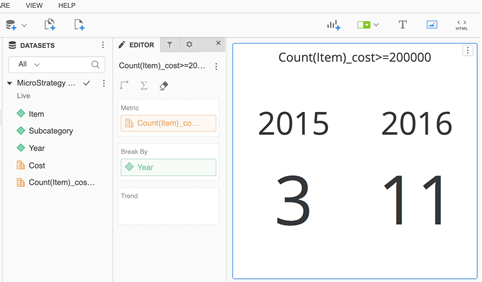
You must add Year to the output level of the metric qualification to get the correct results.
The metric values are now correct.
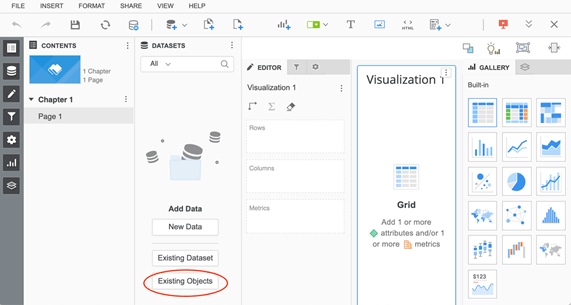
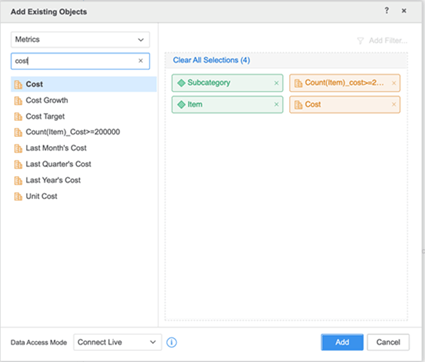
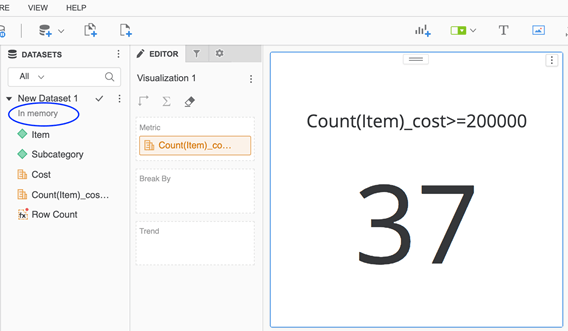
When adding existing objects to your dossier, you can set the data access mode as In memory.
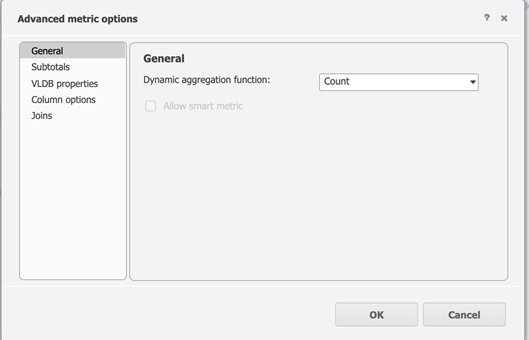
As shown below, the "Count(Item)_cost>=200000" metric returns the expected value. In this case, the data for {Subcategory, Item, Cost, Count(Item)_cost>=200000} is first retrieved from warehouse to memory when the metric qualification is applied at the report level {Item}. Then, the query for the visualization is run against the in-memory dataset for dynamic aggregation on the metric, Count(Item)_cost>=200000. Note that the dynamic aggregation function is set to Count (from step 2 in Steps to Reproduce).
When more attributes are added to the dataset and visualization, the metric value will change accordingly.