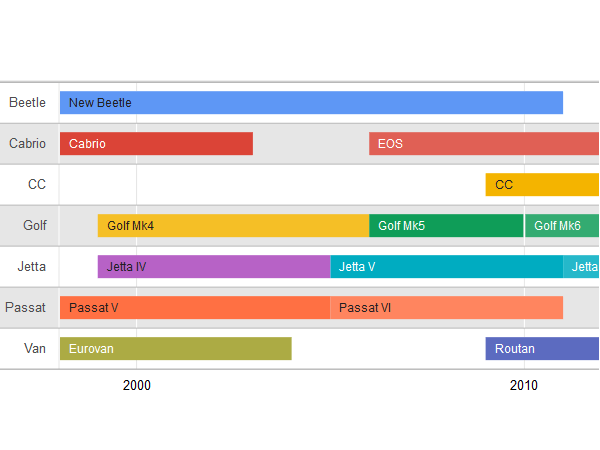
Visualize data as events arranged in chronological order along a bar, using any time scale. Most timelines use a linear scale, with a specific unit of distance equal to a specific amount of time. Each event can be a single point in time or a date range. Timelines allow users to see the duration of events, the time that elapses between events, and the overlap between events.
Timelines are frequently used for managing resources and for understanding historical events and trends.
Requirements
Object requirements:
Minimum Strategy version: 10.2
Current visualization version: 1.0
Publisher: Strategy
Strategy Features
Installation instructions
Notes
This visualization might not auto-size when exporting via PDF.
Currently, the visualization does not support filtering selectors. However, there is an enhancement request already logged about this functionality. Please contact Strategy Tech Support to obtain the latest status on the general availability.
Visualization Disclaimer
By downloading or using this visualization, you accept and acknowledge these terms.
This visualization is both intended as sample code and provided as a convenience to Strategy users. Strategy cannot guarantee that the code provided will apply to any Strategy releases and clients outside of the versions stated within this article. This sample is supported by Strategy Technical Support up to and including the basic visualization functionality listed in this article. Defects will be triaged by the Strategy team as they are raised. For users with active Strategy Technical Support contracts, contact Strategy Technical Support to raise these defects.
Anyone seeking to use this visualization is encouraged to review and adapt this sample based on user requirements. Contact Strategy Professional Services for assistance with these same adaptations. If users would like to provide feedback on or recommendations for this visualization, post in the comments section of this article.