Starting with the release of Strategy ONE (March 2024), dossiers are also known as dashboards.
Tornado Charts, also known as Butterfly charts, is an effective visualization technique for comparing two data series side by side.
Tornado diagrams, also called tornado plots or tornado charts, are a special type of Bar chart, where the data categories are listed vertically instead of the standard horizontal presentation, and the categories are ordered so that the largest bar appears at the top of the chart, the second largest appears second from the top, and so on. They are so named because the final chart visually resembles either one half of or a complete tornado. For example, this representation is ideal for displaying data comparing this year and last year sales values which is very common measure in the Retail industry.
View the image below for reference:
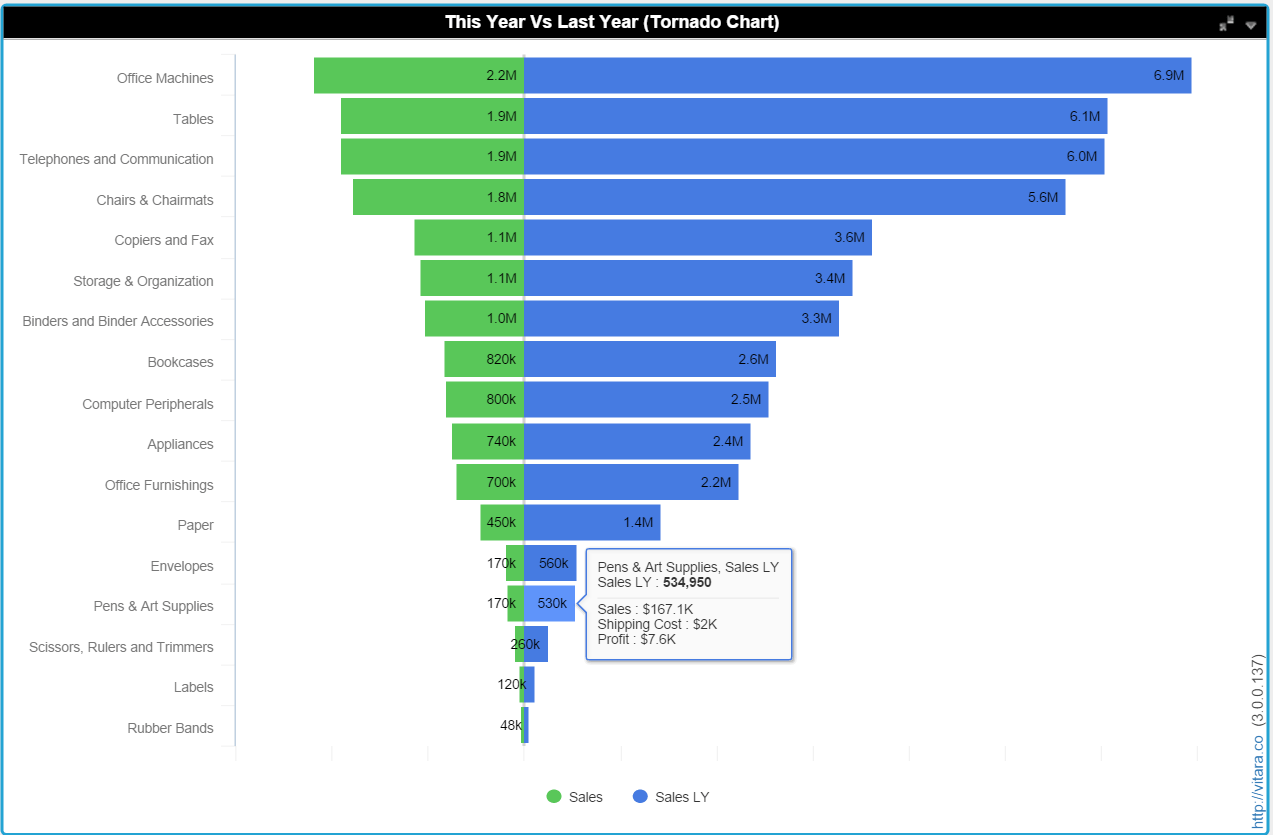
Note that the Time attribute (Optional for Play Axis) and additional Metrics can be added to Tooltips as shown in screenshot.
Minimum Strategy version: 10.3
MicroStrategy Features
Vitaracharts is now FREE for Desktop and Workstation.
Please contact sales@vitaracharts.com to get a 30-day trial key.
Take note that this visual is a part of the VitaraCharts library.
Download visualizations: www.vitaracharts.com
Online interactive visualizations can be accessed here: https://cloud.vitaracharts.com
Publisher: Vitara
Vitara is a Strategy technology partner and offers a fully supported, production-ready chart plugin (VitaraCharts) with 30+ stunning visualizations to enhance Strategy analytics. All Vitara visualizations are customizable and supported through upgrades for a hassle-free experience. We perform extensive testing for backward compatibility with all currently certified versions of Strategy and also ensure all new versions of Strategy are tested and supported across all charts.
For more details please contact sales@vitaracharts.com or www.vitaracharts.com.
Note that Vitaracharts is now FREE for Desktop and Workstation
Contact Vitara sales@vitara.co for a 30 day free trial key.
Download Visualizations here. Online Interactive visualizations can be accessed here.
For Desktop use, just import the downloaded VitaraCharts.zip file as a new visualization.
Note that for custom visualizations to work in mobile, you need to also include the MobileBase plugin provided by Strategy in the mobile plugins directory. Report Services documents are fully supported (for viewing) in mobile. Also note that there are some limitations for viewing VI dashboards in mobile. These limitations will be removed in a soon to be released update. Stay tuned for more information.
Access Strategy web to open a dashboard or document with VitaraCharts included.
Interested in learning more about Dossier authoring? Visit the Learning Center on Community!
Or go to our Documentation pages for more product information.