Starting with the release of Strategy ONE (March 2024), dossiers are also known as dashboards.
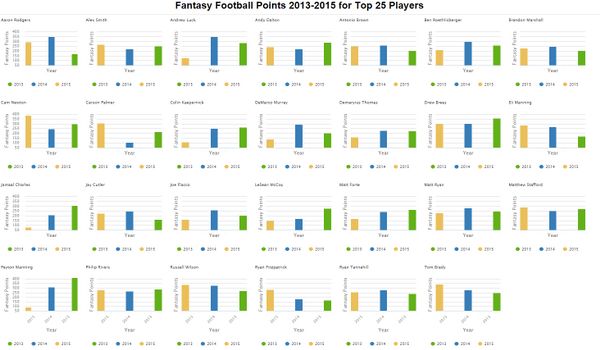
A small multiple sometimes called trellis chart, lattice chart, grid chart, or panel chart is a series of similar graphs or charts using the same scale and axes, allowing them to be easily compared. It uses multiple views to show different partitions of a dataset.
With Vitara's Trellis chart multiple styles can be applied like bar chart, column chart or line chart. Color by attributes and other formatting features can be used to easily convey information to end users. Ideal for comparing performance of like attributes like product category sales over several years , sales representatives performance over quarters , SAT scores by object for several years etc
Requirements :
Minimum Strategy version 10.3
Current Version : 2.3
MicroStrategy Features
Vitaracharts is now FREE for Desktop and Workstation.
Please contact sales@vitaracharts.com to get a 30-day trial key.
Take note that this visual is a part of the VitaraCharts library.
Download visualizations: www.vitaracharts.com
Online interactive visualizations can be accessed here: https://cloud.vitaracharts.com
Publisher: Vitara
Vitara is a Strategy technology partner and offers a fully supported, production-ready chart plugin (VitaraCharts) with 30+ stunning visualizations to enhance Strategy analytics. All Vitara visualizations are customizable and supported through upgrades for a hassle-free experience. We perform extensive testing for backward compatibility with all currently certified versions of Strategy and also ensure all new versions of Strategy are tested and supported across all charts.
For more details please contact sales@vitaracharts.com or www.vitaracharts.com.