EducationSoftwareStrategy.com
StrategyCommunity

Knowledge Base

Product

Community

Knowledge Base

TopicsBrowse ArticlesDeveloper Zone

Product

Download SoftwareProduct DocumentationSecurity Hub

Education

Tutorial VideosSolution GalleryEducation courses

Community

GuidelinesGrandmastersEvents
x_social-icon_white.svglinkedin_social-icon_white.svg
Strategy logoCommunity

© Strategy Inc. All Rights Reserved.

LegalTerms of UsePrivacy Policy
  1. Home
  2. Topics

KB484034: Troubleshooting tips for MicroStrategy Linux system issues


Community Admin

• Strategy


This article provides troubleshooting tips for MicroStrategy Linux system issues.

Troubleshooting application delayed performance or hang issues


Usually, when you encounter delayed performance on your application, or hanging, you can get several pstacks of that process. 
Reviewing those pstacks, you can narrow down the causes of the application issues. Common causes include infinite loops, too many retires of unsuccessful operations, time-consuming tasks, deadlock resulting from locks, and conditional variables. Sometimes, reviewing the pstacks may not explain delayed performance or hanging, and could be a result of system issues or other processes. At this point, you need to get the system-wide logs to further investigate. 
 

Troubleshooting tips for Linux system issues

You should retrieve the following logs: 

  1. Linux system general logs
    Generally, the log files are located in the
    /var/log
    directory. Any other applications that you may later install on your system will most likely throw their log messages here. Once you log into your system, use the the
    ls -l /var/log
    command to view the contents of this directory.
    /var/log/messages Most of the general system messages are logged here, including the messages dyring the system startup. 

    /var/log/cron The cron daemon messages are logged here. Started and stopped jobs, as well as failure messages, can be found. 

    /var/log/maillog or /var/log/mail.log Log information from the mail server running on the server.

    /var/log/wtmp Contains all login and logout history.

    /var/log/btmp Records failed login attempts. 

    /var/log/utmp Logs the present login state of each user.

    /var/log/dmesg Contains very important messages about the kernel ring buffer. This means that when the kernel spins up, it logs all of the information here. The command dmesg can be used to view the messages of this file. 

    /var/log/secure Logs the present login state of each user. Security related messages will be stored here. This includes messages from the SSH daemon, failed passwords, nonexistent users, etc. 

    /var/log/mariadb If MariaDB is installed on the system, then this is the location where it will throw the logs by default.

    /var/log/mariadbmysql If the MySQL database is installed on the system, then this is the default logging directory. 
     
  2. Process running information on the system
    Information like process CPU usage, memory usage, process state, etc.  
     
  3. System I/O usage information

Commands to get logs

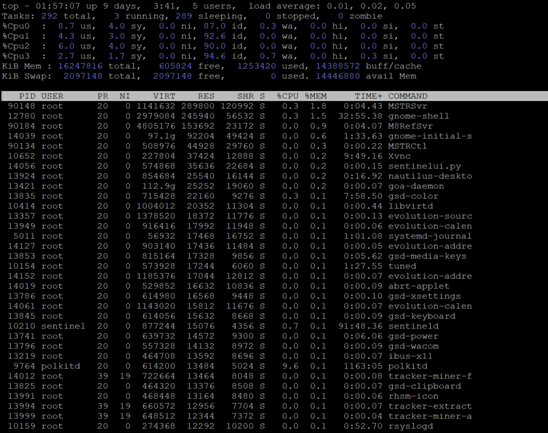
  • top - display Linus processes
    The top program provides a dynamic real-time view of a running system. It can display system summary information as well as a list of processes or threads currently being managed by the Linux kernel. The types of system summary information shown and the types, order and size of information displayed for pro‐ cesses are all user configurable and that configuration can be made persistent across restarts.

    The program provides a limited interactive interface for process manipulation as well as a much more extensive interface for personal configuration -- encompassing every aspect of its operation. And while top is referred to throughout this document, you are free to name the program anything you wish. That new name, possibly an alias, will then be reflected on top's display and used when reading and writing a configuration file.

    Example:
ka04W000001IwuOQAS_0EM2R000000nnnf.jpeg
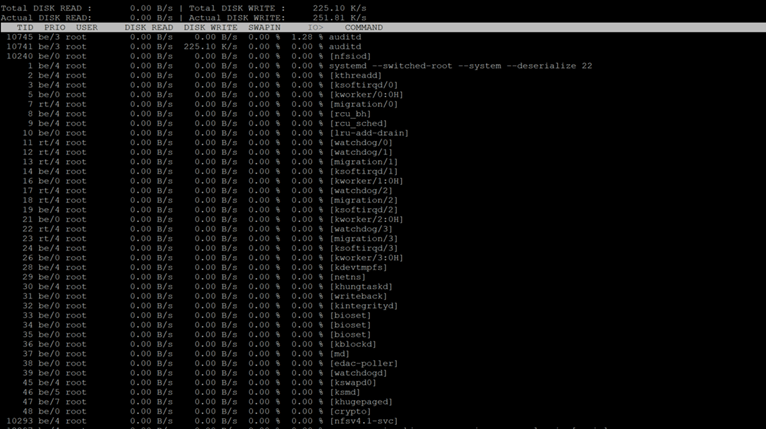
  • iotop - simple top-like I/o monitor
    iotop watches I/O usage information output by the Linux kernel (requires 2.6.20 or later) and displays a table of current I/O usage by processes or threads on the system.
    iotop displays columns for the I/O bandwidth read and written by each process/thread during the sampling period. It also displays the percentage of time the thread/process spent while swapping in and while waiting on I/O. For each process, its I/O priority (class/level) is shown.

    In addition, the total I/O bandwidth read and written during the sampling period is displayed at the top of the interface. Total DISK READ and Total DISK WRITE values represent total read and write bandwidth between processes and kernel threads on the one side and kernel block device subsystem on the other. While Actual DISK READ and Actual DISK WRITE values represent corresponding bandwidths for actual disk I/O between kernel block device subsystem and underly‐ ing hardware (HDD, SSD, etc.). Thus Total and Actual values may not be equal at any given moment of time due to data caching and I/O operations reordering that take place inside Linux kernel.

    Example
ka04W000001IwuOQAS_0EM2R000000nnnu.jpeg
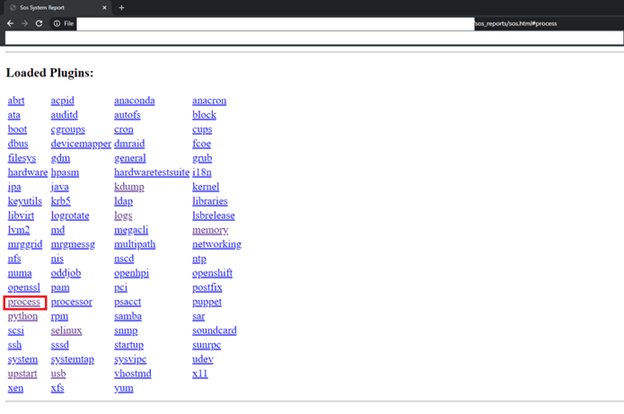
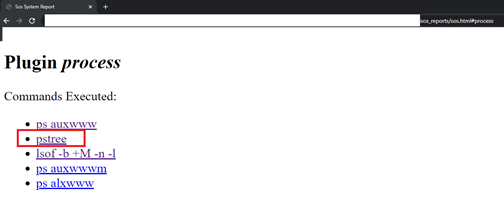
  • sosreport - collect and package diagnostic and support data
    sosreport generates an archive of configuration and diagnostic information from the running system. The archive may be stored locally or centrally for recording or tracking purposes or may be sent to technical support representatives, developers or system administrators to assist with technical fault-find‐ ing and debugging.
    sos is modular in design and is able to collect data from a wide range of subsystems and packages that may be installed. An XML or HTML report summarizing the collected information is optionally generated and stored within the archive.

    Example
ka04W000001IwuOQAS_0EM2R000000nno4.jpeg
ka04W000001IwuOQAS_0EM2R000000nnoY.jpeg
ka04W000001IwuOQAS_0EM2R000000nno9.jpeg

Script to get logs at one time

  1. On the Linux machine, paste the following script into a 
    CollectLog.sh
    file:
    
    # !/bin/bash
    # Usage: ./CollectLog.sh
    # This script needs to be run during slowness/hang 
    # This script collects below 3 kinds of logs: 
    #   1. top logs in thread level every 5 seconds in 5 minutes
    #   2. iotop logs every 5 seconds in 2.5 minutes
    #   3. sosreport log 
    # There are 3 files: sosreport-xxxx-xxxx.tar.xz, topdata.log 
    # and iotopdata.log will be generated after script execution done.
    
    echo "CatchingTopData every 5 seconds in 5 minutes ..."
    top -H -c -b -d 5 -n 60 > topdata.log &   
    iotop -b -d 5 -n 30 > iotopdata.log &
    sosreport
    echo "waiting for topdata collecting to be done..."
    sleep 300
    echo "all the log has been collected!"
    

  2. Chomod 777
    ./CollectLog.sh
  3. Run the script in the command
    ./CollectLog.sh
  4. The script will execute in around eight minutes
  5. The
    sosreport-xxxx-xxxx.tar.xz
    ,
    topdata.log
    , and
    iotopdata.log
    are generated

Example to check the logs


top - 05:19:45 up 99 days, 6:06, 18 users, load average: 42.38, 28.31, 25.19
Threads: 3093 total, 11 running, 3082 sleeping, 0 stopped, 0 zombie
%Cpu(s): 9.4 us, 22.3 sy, 0.0 ni, 37.2 id, 27.8 wa, 0.0 hi, 3.3 si, 0.0 st
KiB Mem : 51579673+total, 23363131+free, 67859696 used, 21430572+buff/cache
KiB Swap: 4063228 total, 2740772 free, 1322456 used. 44056601+avail Mem
PID USER PR NI VIRT RES SHR S %CPU %MEM TIME+ COMMAND
34346 root 20 0 68.6g 53.7g 171296 R 97.8 10.9 0:15.72 MSTRSvr
36409 root 20 0 96368 5008 3008 R 96.8 0.0 0:12.49 perf
31797 root 0 -20 0 0 0 S 67.1 0.0 3:34.01 kworker/6:1H
34348 root 20 0 68.6g 53.7g 171296 R 59.1 10.9 0:07.63 MSTRSvr
36435 root 0 -20 0 0 0 R 26.5 0.0 0:00.83 kworker/6:2H
….
34351 root 20 0 68.6g 53.7g 171296 D 15.7 10.9 0:07.38 MSTRSvr
34349 root 20 0 68.6g 53.7g 171296 R 15.3 10.9 0:06.12 MSTRSvr
34350 root 20 0 68.6g 53.7g 171296 D 15.0 10.9 0:03.61 MSTRSvr
34347 root 20 0 68.6g 53.7g 171296 D 14.7 10.9 0:06.53 MSTRSvr
…
36287 root 20 0 0 0 0 D 1.0 0.0 0:00.55 kworker/u256:3
…
35749 root 20 0 68.6g 53.7g 171296 D 0.3 10.9 0:00.02 MSTRSvr
36301 root 20 0 68.6g 53.7g 171296 D 0.3 10.9 0:00.04 MSTRSvr
…

  1. The above log is shown in thread -level, after checking, there are about 30+ threads in "D" state.
  2. After reviewing through the top log, you can see the system load average is high, with 32 cores on the machine.
  3. .D state code code means that the process is in uninterruptible sleep, and that may mean different things, but it is usually I/O. System load averages is the average number of processes that are either in a runnable or uninterruptable state. A process in a runnable state is either using the CPU or waiting to use the CPU. A process in uninterruptable state is waiting for some I/O access, e.g. waiting for disk.
  4. Further checking what the “D“ state process is doing, echo w > /proc/sysrq-trigger; dmesg will tell the kernel to report all stack traces for D-state processes in dmesg buffer. The following are the different types of kernel call stacks that can be found:

    Call Trace1:
    
    [] ? seq_vprintf+0x32/0x60
    [] ? seq_printf+0x3d/0x40
    [] rwsem_down_failed_common+0x95/0x1d0
    [] ? arch_report_meminfo+0x6c/0x80
    [] rwsem_down_read_failed+0x26/0x30
    [] call_rwsem_down_read_failed+0x14/0x30
    [] ? down_read+0x24/0x30
    [] __do_page_fault+0x194/0x500
    [] do_page_fault+0x3e/0xa0
    [] page_fault+0x25/0x30
    [] ? copy_user_enhanced_fast_string+0x6/0x10
    [] ? seq_read+0x300/0x430
    [] proc_reg_read+0x80/0xc0
    [] vfs_read+0xb7/0x1a0
    [] ? fget_light_pos+0x3f/0x50
    [] ? system_call_after_swapgs+0xa2/0x152
    [] sys_read+0x51/0xb0
    [] ? system_call_after_swapgs+0xa2/0x152
    [] ? system_call_after_swapgs+0xae/0x152
    [] system_call_fastpath+0x35/0x3a
    [] ? system_call_after_swapgs+0xae/0x152
    

    Call Trace2:
    
    [] rwsem_down_failed_common+0x95/0x1d0
    [] rwsem_down_read_failed+0x26/0x30
    [] call_rwsem_down_read_failed+0x14/0x30
    [] ? down_read+0x24/0x30
    [] vx_rwlock+0x4e/0xe0 [vxfs]
    [] vx_write+0x1f6/0x380 [vxfs]
    [] vfs_write+0xba/0x1a0
    [] ? fget_light_pos+0x3f/0x50
    [] ? system_call_after_swapgs+0xa2/0x152
    [] sys_write+0x51/0xb0
    [] ? system_call_after_swapgs+0xa2/0x152
    [] ? system_call_after_swapgs+0xae/0x152
    [] system_call_fastpath+0x35/0x3a
    [] ? system_call_after_swapgs+0xae/0x152
    

    From the above call traces, you can see the "D" state threads are doing vfs_read or vfs_write. During this, “
    vx_nospace - /dev/vx/xxx/xxxx/xxxx file system full (64 block extent)
    ,“ can be found in in
    sosreport-mandar.xxxxx-xxxxxxxx/var/log/messages.

    You need to ask the filesystem vendor to check whether the file system is working properly or not.
     

References

Rose Hosting Linux Log Files


Linux Programmer's Manual 


Comment

0 comments

Details

Knowledge Article

Published:

February 11, 2020

Last Updated:

February 11, 2020