Starting with the release of Strategy ONE (March 2024), dossiers are also known as dashboards.
There are several ways to create a Visual Insights dashboard from a prompted report. However, the dashboard behavior differs depending on whether the Visual insights dashboard was created through the web folder or by first opening the prompted report to create a dashboard from the tool menu.
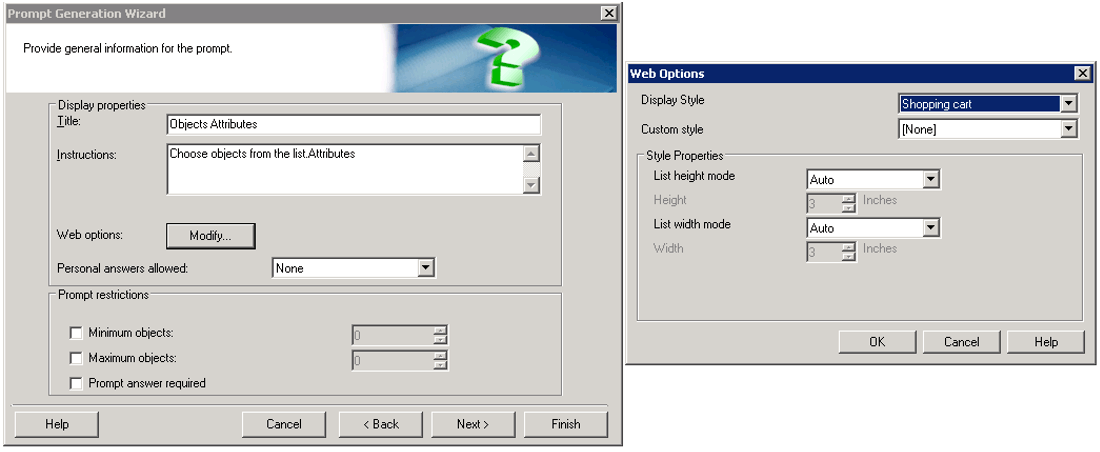
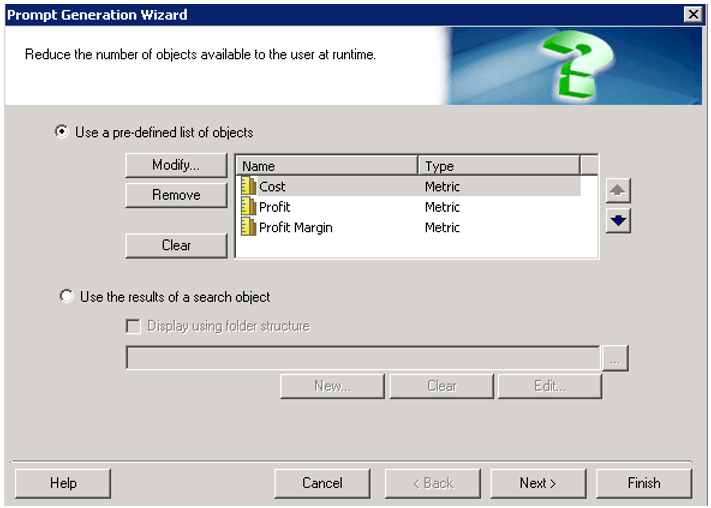
1. Create a report with:
a. An object prompt for one or more metrics placed on the columns.

b. An object prompt for one or more attributes placed on the rows.

2. Run the following tests:
a. Test one: Right-click on a report and select Create dashboard.
Through this method of creating a dashboard, the answers to the object prompts are not automatically added to the visualization. Instead, they must be manually dragged in.
b. Test two: Run the report. From the Tools menu, click the Create dashboard link.
Through this method, the answers to the metric object prompt are added to the visualization automatically, however, the answers to the attribute object prompt are not.
This is an expected behavior in Strategy.
In Test one, when you right-click on a report and select Create Dossier, a document definition is created before answering the prompts and the view template of the report is currently null. Then there is a fall back logic where the grid in the dashboard is initialized with the data template of the report, but the axes in the data template have no unit, so the grid will be empty.
In Test two, since the report has been executed, the view template of the report is not null and there are units in the axes because the prompts have been answered. In this case, the grid in the dashboard is initialized with the report's view template, so the grid is not empty.
KB439886
