Starting with the release of Strategy ONE (March 2024), dossiers are also known as dashboards.
SYMPTOM
In Visual Insight dashboards, it is not possible to modify the colors of the graphs if the attribute is a derived element and the derived element was created in a dataset.
STEPS TO REPRODUCE
1. In Tutorial, create a report with Year and Month of Year as attributes; and Revenue as metric.
2. Run the report
3. Using CTRL, select Jan, Feb and March, and create a group (derived element) for Q1.
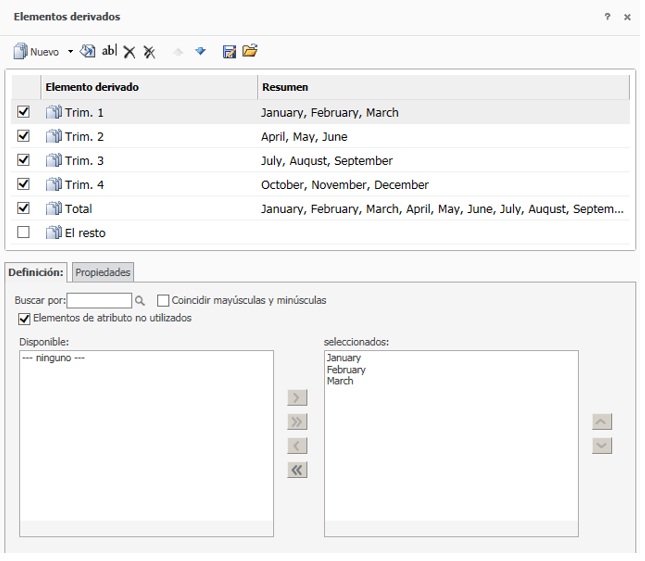
4. Repeat for Q2, Q3 and Q4.
5. Save the report
6. Create a Dashboard/Dossier (VI) based on that report
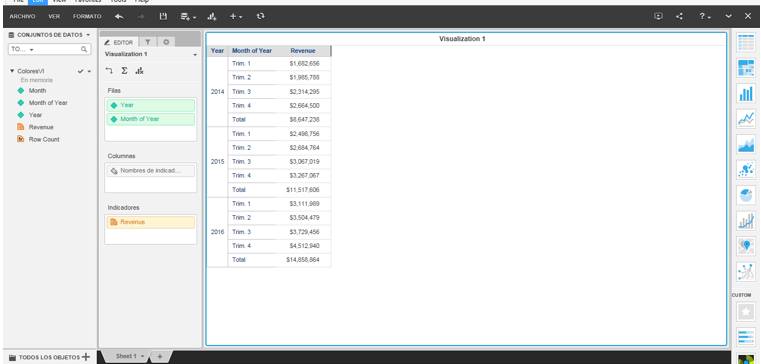
7. Change the visualization to line graph, using Revenue for vertical, Year for horizontal, Month of year for color by, and Month of year for break by.
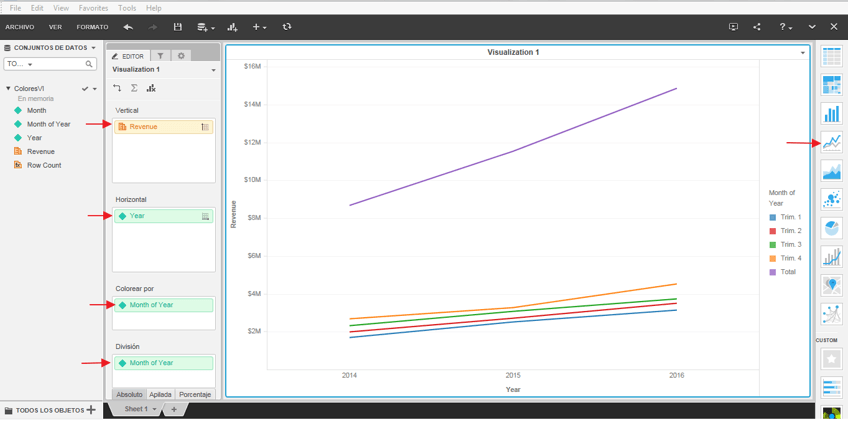
8. Right click the legend color and try to change the color of one of the lines. The color is not changed.
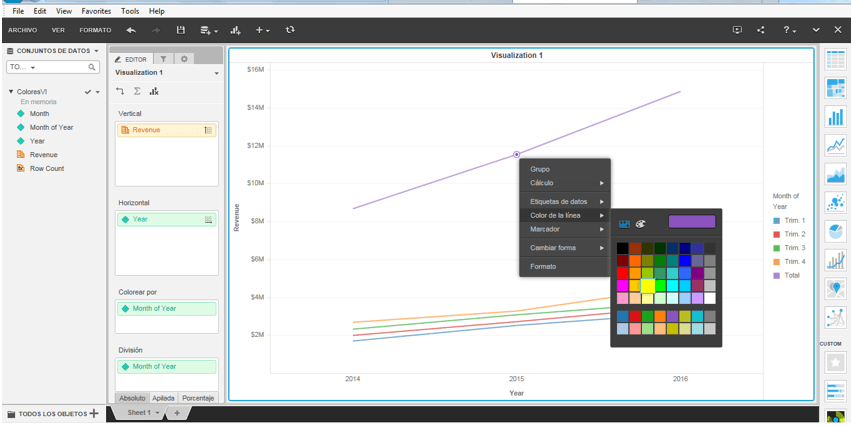
9. Try also to change the color using the format tab. The color is not changed.
ACTION
This issue was reviewed by our Technology team for feasibility and will not be scoped for a code fix in any upcoming Strategy release.
WORKAROUND
By Creating derived elements in VI, comparing to method mentioned in the dataset as in the reproduce steps the issue is not encountered. Steps to create the derived element in VI are as follows:
In Tutorial
1. Create a report with Year and Month of Year as attributes; and Revenue as metric.
3. Save the report
4. Create a Dashboard/Dossier (VI) based on that report
5. In grid mode, using CTRL, select Jan, Feb and March, and create a group (derived element) for Q1
6. Repeat for Q2, Q3 and Q4.
8. Change the visualization to line graph, using Revenue for vertical, Year for horizontal, Month of year for color by, and Month of year for break by.
9. Right click the legend color and try to change the color of one of the lines. KB440017
