Starting with the release of Strategy ONE (March 2024), dossiers are also known as dashboards.
SYMPTOM
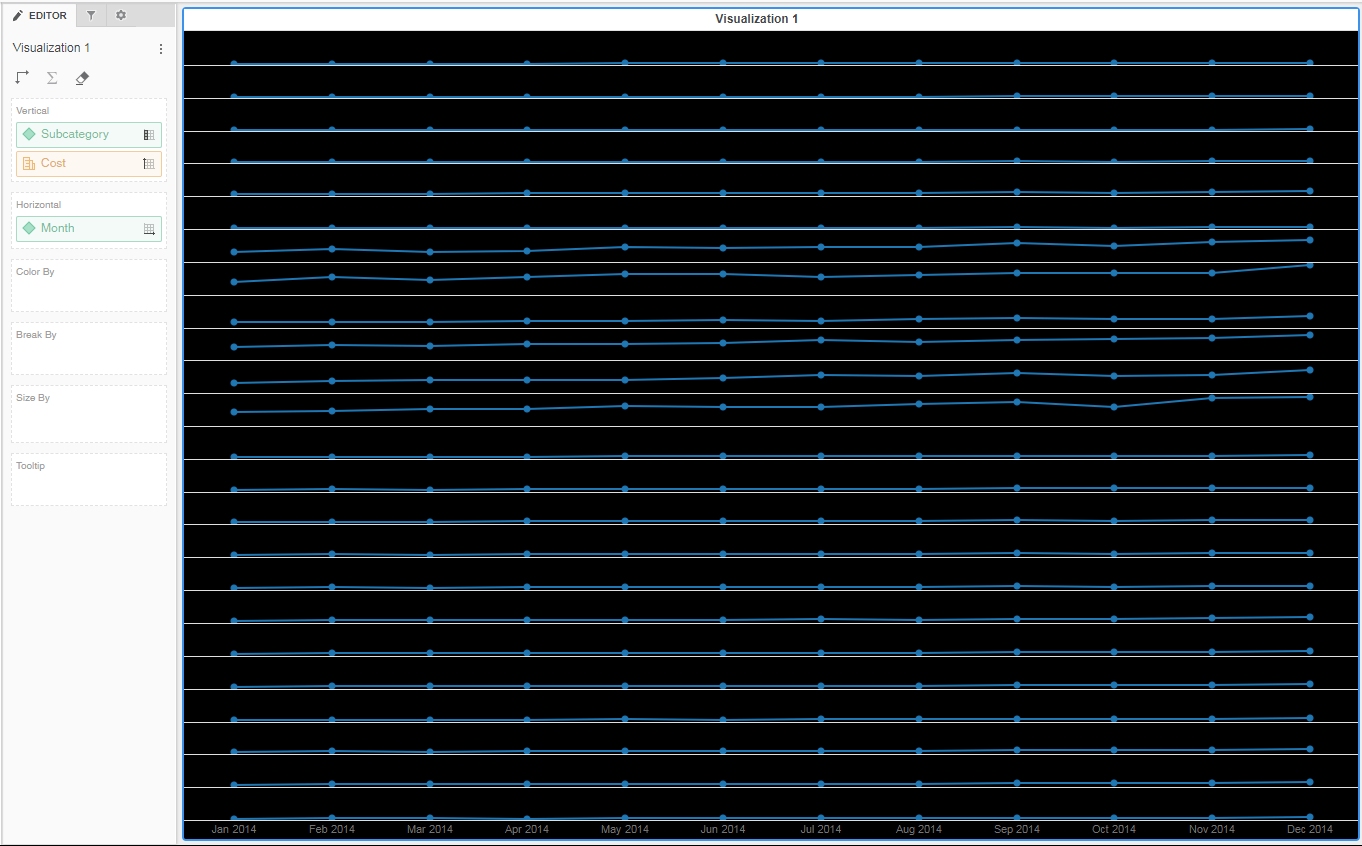
Visualization (Line Chart) does not display full content when executing Document - only after adjusting height on graph or refreshing the graph by using selector the full content is displayed. Visualization is imported from Dossier because in Dossiers there are more formatting options available. When you execute the Document the graph visualization is showing only couple months and it should show data for 12 months.
STEPS TO PRODUCE:

CAUSE:
This is a defect and Development Team is working on implementing fix for this issue.
ACTION:
Contact Strategy Technical Support for an update on this issue.
KB441930
