Starting with the release of Strategy ONE (March 2024), dossiers are also known as dashboards.
VitaraCharts recently held their 2020 Dashboard Competition, leveraging the power of Strategy along with the flexibility of VitaraCharts visualizations and features. The competition challenged participants to create compelling dashboards with the expert use of data, visualizations and graphics, including some of the latest features available in Strategy 2020. Below are the runners-up and winners of this year's competition, with some very interesting topics and fantastics demonstrations of Strategy capabilities.
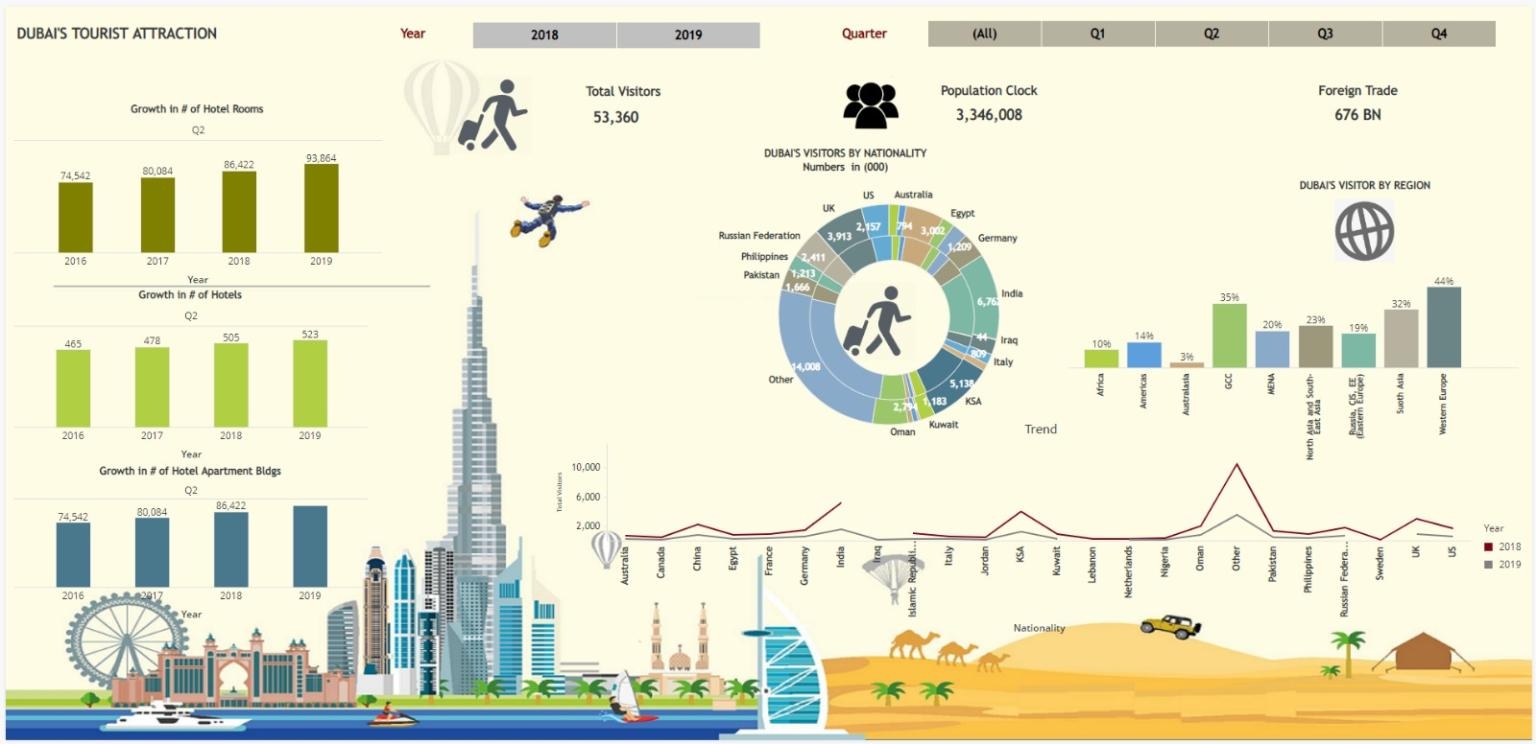
In third place was a tie including Ramkumar Venkatsubbu's submission on the city of Dubai, including topics such as population, economy, and transportation. The use of free-form dossier layouts allowed for engaging backgrounds for some of the pages in addition to the freedom to place visualizations in empty space within the image.
https://www.linkedin.com/feed/update/urn:li:activity:6625325204904206336/
The second 3rd place winner is Reema Mohanty and Rajavel, analyzing data for crime and suicide in India. In addition to data analysis, the use of images and links to WHO Suicide Preventation Campaign handouts for different professions.
https://www.linkedin.com/feed/update/urn:li:activity:6625326655747518464/

In second place is Manish Gupta, analyzing the global migrant crisis from 2015-2019. The visualizations show how many lives this crisis has impacted over the last 4 years, as well as its vast reach throughout the world.
https://www.linkedin.com/feed/update/urn:li:activity:6625323789850906624/
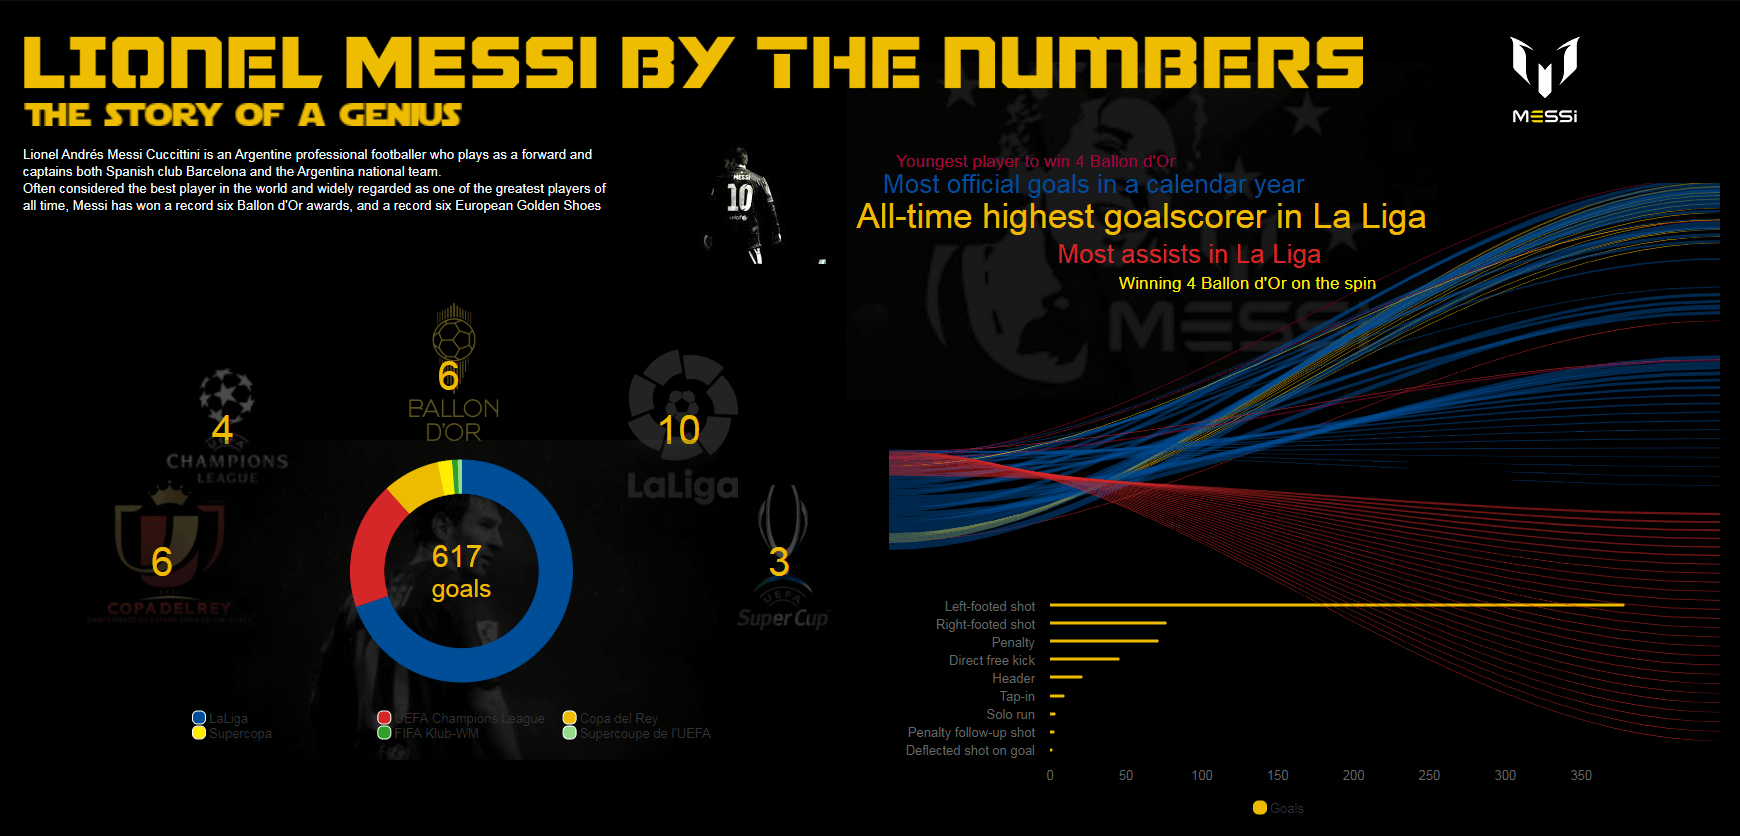
The first place winner is Elmernikh Nabil with a dossier about the impact of Lionel Messi to his sport in both club and national team contributions. The content of this dossier ranges from his achievements and awards as a player, a breakdown of his impact statistically across different leagues and tournaments, and concludes with a final statistical comparison to another Argentinian considered among one of the greatest football players of all time: Diego Maradona.
https://www.linkedin.com/posts/hpratapa_microstrategy-vitaracharts-dashboard-activity-6625321405032562688-wPZ_/