Starting with the release of Strategy ONE (March 2024), dossiers are also known as dashboards.
Also known as the "square pie chart", the waffle chart is a very useful visualization that helps display progress toward goals. This kind of chart is a relatively effective option when you want to add an interesting visualization to your dashboard without distorting the data or taking up too much dashboard real estate. Its ideal for displaying KPIs, percent contributions, and other simple distributions over a single dimension.
This chart improves the perception of represented information. The waffle chart is a chart in the shape of a square with small squares inside the big square. It is used to show the percentage of a certain category compared to all the categories. The hart is a great alternative to the pie chart. Instead of using angle to represent parts of a whole, the square version uses, well, squares.
Vitaracharts offers Waffle charts in three options for custom markers:
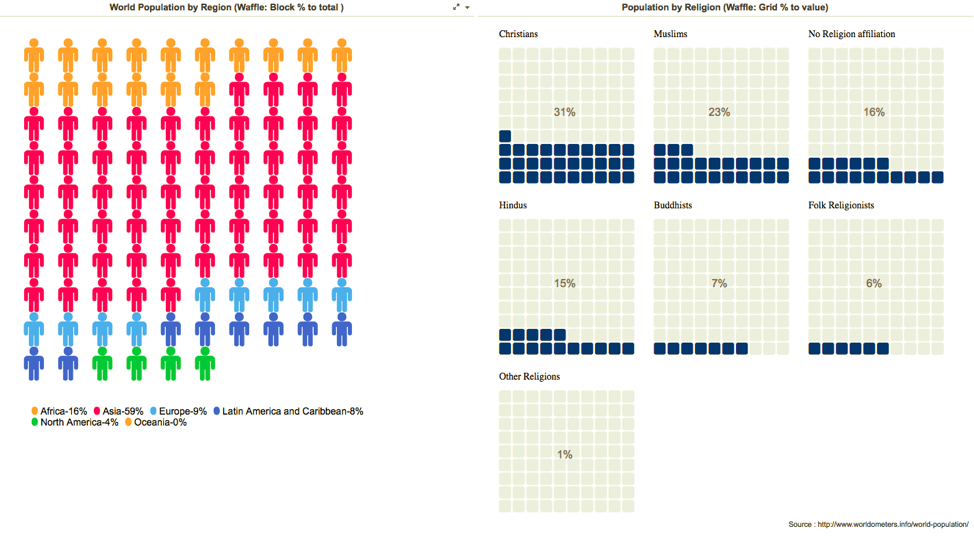
Note: The example screenshot shows the % to total waffle chart with world population across different continents but the square has been replaced with a custom marker of a human figure. The second shows a grid waffle represents the religious affiliation of the World’s population. View the image below for reference:
Minimum Strategy version: 10.3 or higher
MicroStrategy Features
Vitaracharts is now FREE for Desktop and Workstation.
Please contact sales@vitaracharts.com to get a 30-day trial key.
Take note that this visual is a part of the VitaraCharts library.
Download visualizations: www.vitaracharts.com
Online interactive visualizations can be accessed here: https://cloud.vitaracharts.com
Publisher: Vitara
Vitara is a Strategy technology partner and offers a fully supported, production-ready chart plugin (VitaraCharts) with 30+ stunning visualizations to enhance Strategy analytics. All Vitara visualizations are customizable and supported through upgrades for a hassle-free experience. We perform extensive testing for backward compatibility with all currently certified versions of Strategy and also ensure all new versions of Strategy are tested and supported across all charts.
For more details please contact sales@vitaracharts.com or www.vitaracharts.com.
Interested in learning more about Dossier authoring? Visit the Learning Center on Commuity!
Or visit our Documentation pages for more product information.