Starting with the release of Strategy ONE (March 2024), dossiers are also known as dashboards.
Show how categories increase or decrease the value of a metric with the out-of-the-box Waterfall Chart.
Minimum Strategy version: 10.11
Requirements:
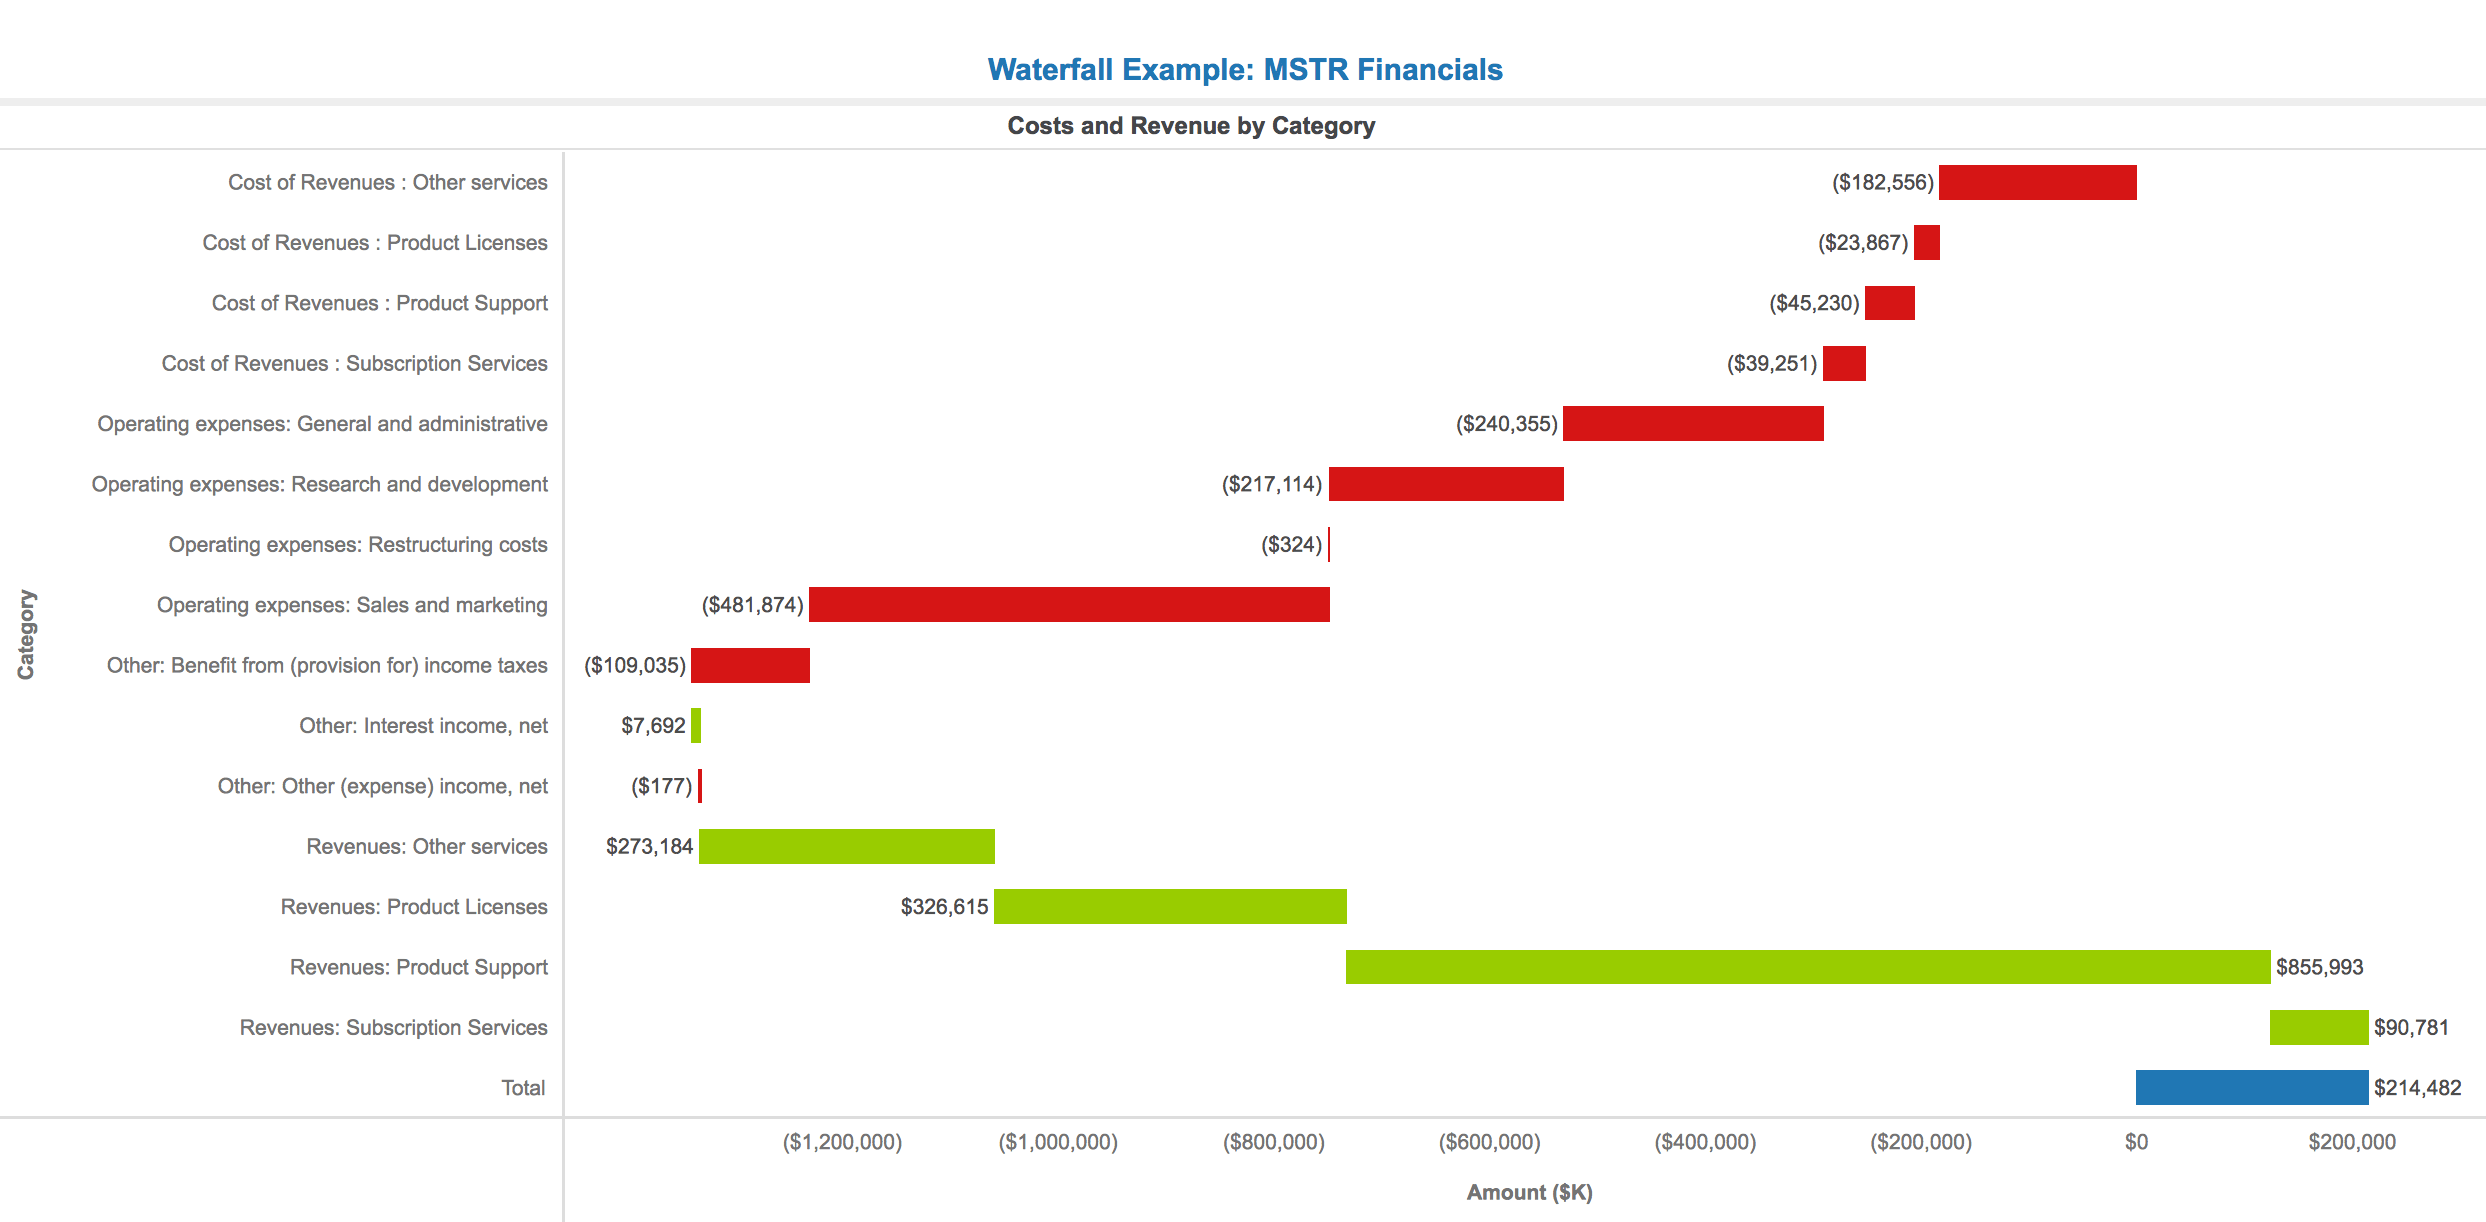
Data from the MSTR Financials dossier
A Waterfall visualization encodes data using length and color to show how the value of a metric increases and decreases across categories. We can think of the Waterfall Chart as a special case of a Bar Chart, in which each new bar begins where the previous bar ended. Waterfall Charts are different from Line Charts in that their attribute axis is usually broken apart by a category, not a unit of time. Waterfall Charts help to examine how these categories positively or negatively impact the value of a given metric.
Waterfall Charts are most commonly used for monetary records such as income statements. In this example, we created a Waterfall Chart to explore the quarterly income statements for Strategy (MSTR) from 2015 to 2017. We wanted to highlight the net income at the end of a given quarter and investigate how it was impacted by certain categories of cost and revenue.
To make this visualization, we put “Category” in the “Vertical” drop zone, and “Amount ($K)” in the “Horizontal” drop zone. We chose to do a horizontal Waterfall chart to make the category names more readable.
When Strategy populates our visualization, it automatically sets negative values to the color red and positive values to green. The total is colored blue and is set to the bottom of the chart. Thus, with a few quick glances at our visualization, we can begin to answer questions about what categories are contributing most to Strategy’s net income. For example, we can look at the largest red bars to determine where Strategy spends the majority of its money. For Q1 2015, “Sales and Marketing” clearly leads the way. Additionally, we can immediately see that the revenue from Product Support, the largest green bar, makes up a majority of Strategy’s income. Finally, we can see that Strategy was profitable in Q4 2015 because the “Total” bar is positioned above the 0 axis. Hovering over the bar shows the ToolTip that displays the exact net income in $K.
As we can see through this example, a Waterfall Chart can be a powerful way to determine how certain types of expenditures and income sources are impacting a company’s bigger picture. With the insights from a Waterfall visualization, stakeholders can make better decisions regarding their costs, revenues and overall profitability.
Another use case for waterfall charts is to examine how different spending and income categories impact monthly budgeting.

Analyze using waterfall charts by downloading MicroStrategy Desktop!
Download the .mstr file to check out the "Waterfall Example: MSTR Financials" dossier.
