EducationSoftwareStrategy.com
StrategyCommunity

Knowledge Base

Product

Community

Knowledge Base

TopicsBrowse ArticlesDeveloper Zone

Product

Download SoftwareProduct DocumentationSecurity Hub

Education

Tutorial VideosSolution GalleryEducation courses

Community

GuidelinesGrandmastersEvents
x_social-icon_white.svglinkedin_social-icon_white.svg
Strategy logoCommunity

© Strategy Inc. All Rights Reserved.

LegalTerms of UsePrivacy Policy
  1. Home
  2. Topics

Workstation Feature: Dossier and Application Telemetry


Yifan Liu

Product Owner • Strategy


Exploring and understanding analysis data on dossier and application objects in workstation

Starting with the release of Strategy ONE (March 2024), dossiers are also known as dashboards.
Best Practices
Dossier and Application Telemetry
In 11.0 Strategy introduced the 'Platform Analytics' application, which helps monitor and track object usage across the Strategy platform in real time. This empowers administrators with telemetry capabilities that capture and analyze usage statistics and performance for objects. 
The new Workstation and Desktop products are designed to make it easy for anyone to create beautiful and useful visual stories and distribute it in their organization with a few clicks. When a content owner creates and distributes a dossier, the first questions he/she will have will be: are end-users using it? Who are my primary users? What is the response time of the dossier and does it error out?
 
Value
 
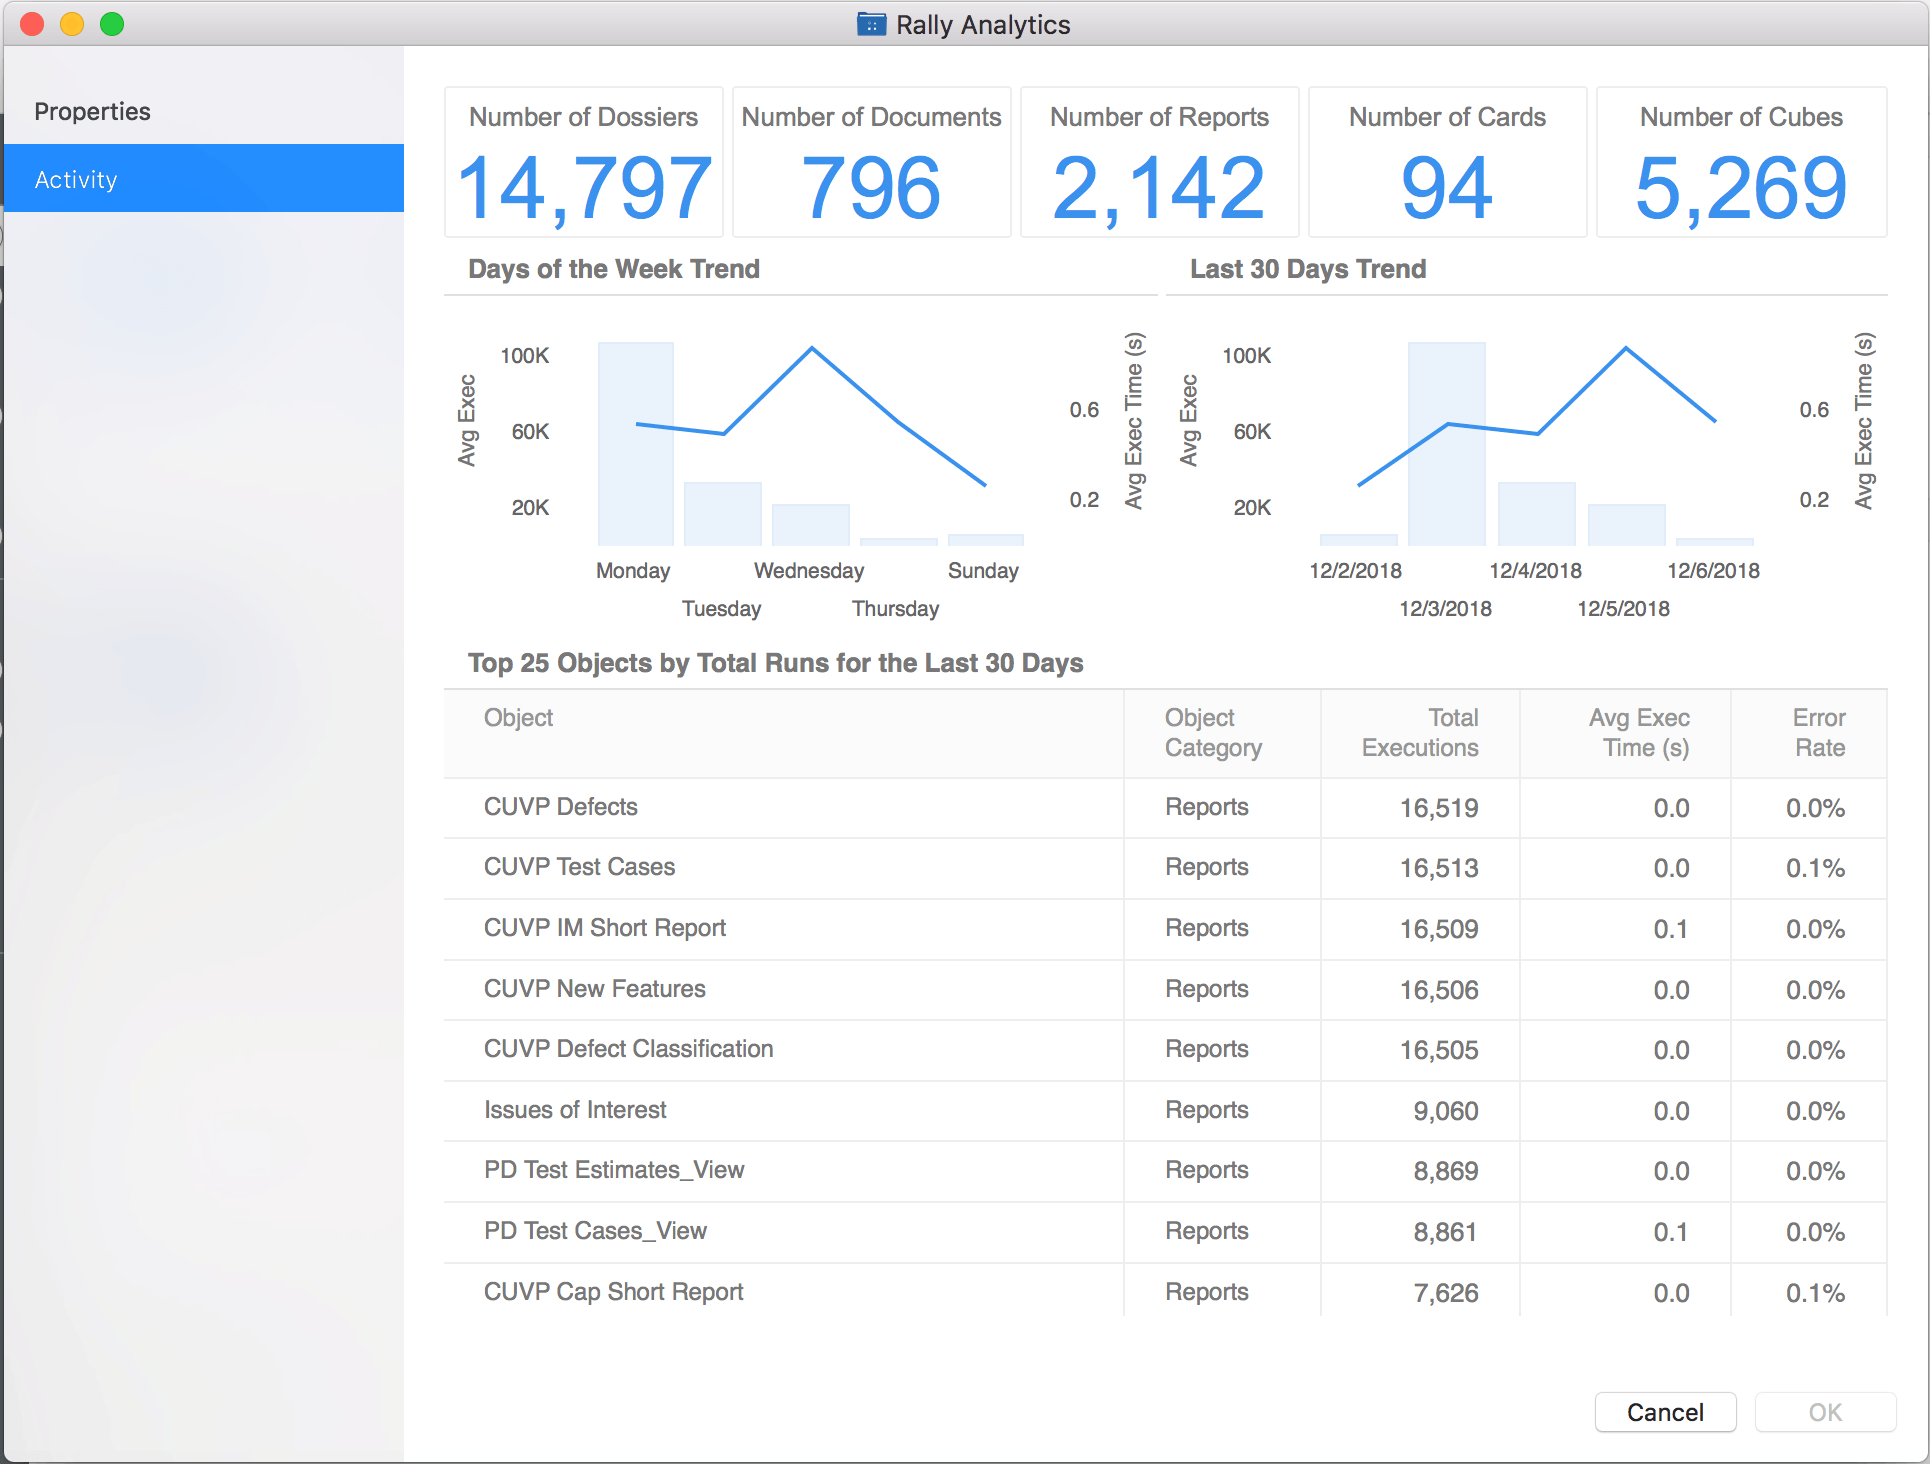
In Workstation, users can see the activity data in the dossier and application object get info windows. As content is being created and distributed, content owners may wonder how their end users are using the content. Some questions/concerns that can be answered by the data:

  • Who are my primary users?
  • What is the response time of the dossier and does it error out?
  • In my application, how many datasets are there?
  • What is the most used object in the application?

 
Architecture
Statistical data is generated as users interact with dossiers and is logged to Kafka. Then the Telemetry Store reads this data and puts it into a database. This database acts as the data warehouse for a Platform Analytics application. Inside of this application resides the telemetry dossiers used to display the Activity statistics. These telemetry dossiers are accessed through a dossier or application's get info dialog. The telemetry dossier is presented using Embedded SDK to display a web dossier into a Workstation window.

ka0PW0000001JWLYA2_0EM44000000RRSe.png

The telemetry dossiers are hidden from browsing by default, so they won't appear in Library, Web or when users are browsing from Workstation. These dossiers get their data from the Platform Analytics cube. This cube is scheduled to publish once every hour by default, caching the latest data for quick access. The cube can be published manually to see the most up-to-date data. The publishing schedule can also be customized.
Requirements
Here are some of the requirements that must be met in order to successfully see the telemetry.

  • The current environment must be correctly configured to a valid Platform Analytics application.
    • Platform Analytics exists in environments 11.0+
    • The administrator can go into the get info window for the current environment and select the appropriate environment in the Platform Analytics section.
  • The current environment must be pointing to an environment with a valid PA application configured. This can be set through the environment Get Info dialog as shown below
ka0PW0000001JWLYA2_0EM44000000RU72.png
  • The Platform Analytics cube must be published for the data to show up correctly and in real time.
  • The current user must have view access to the PA project.

 
Action Steps
 
Application Activity

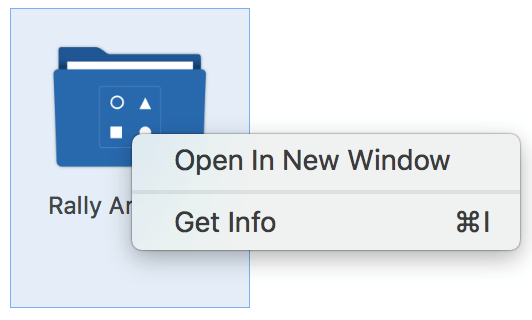
  • Right-mouse-click application and select ‘Get Info’
ka0PW0000001JWLYA2_0EM44000000RRPf.png
  • Open to ‘Activity’ tab
ka0PW0000001JWLYA2_0EM44000000RRPk.png

Dossier Activity
*Same as steps above, except right-mouse-click a dossier
 
Sample Workflows
Use Case 1: Viewing telemetry

  1. Connect to an environment
  2. Go to Dossiers (or Applications) tab
  3. Right mouse click on the wanted dossier (or application) and select 'Get Info'
  4. In the Get Info dialog, select the 'Activity' tab

Use Case 2: Viewing telemetry when PA is on a different environment
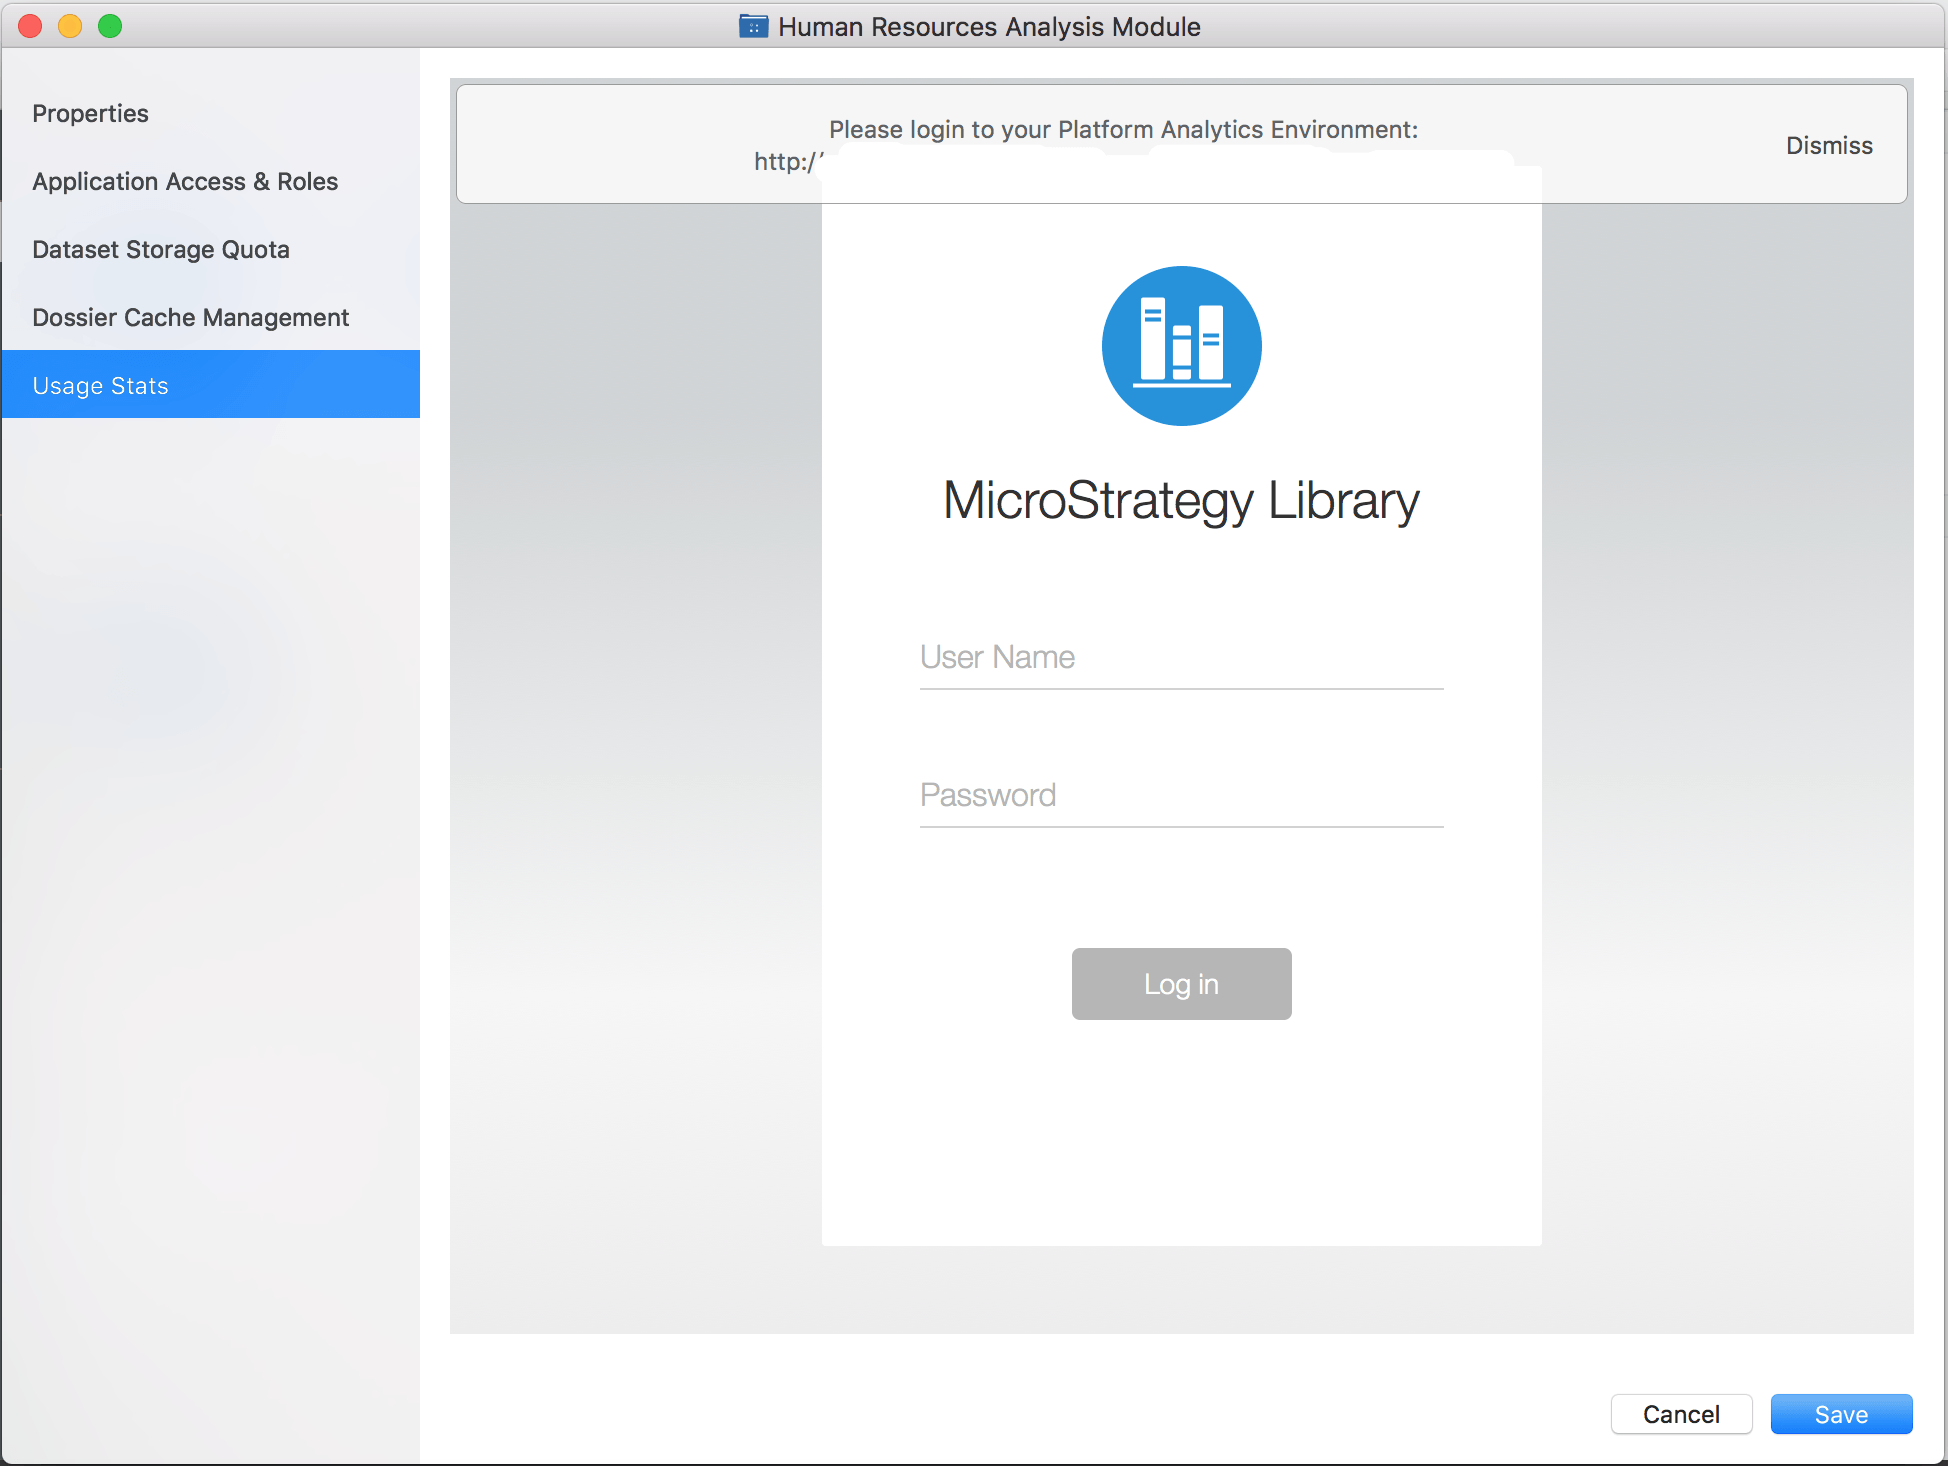
  • Connect to an environment
  • Go to Dossiers (or Applications) tab
  • right mouse click on the wanted dossier (or application) and select 'Get Info'
  • In the Get Info dialog, select 'Activity'
  • If you are not logged into the PA environment, you will be prompted to log into your PA environment with a user account to see the usage activity.
ka0PW0000001JWLYA2_0EM44000000RU77.png

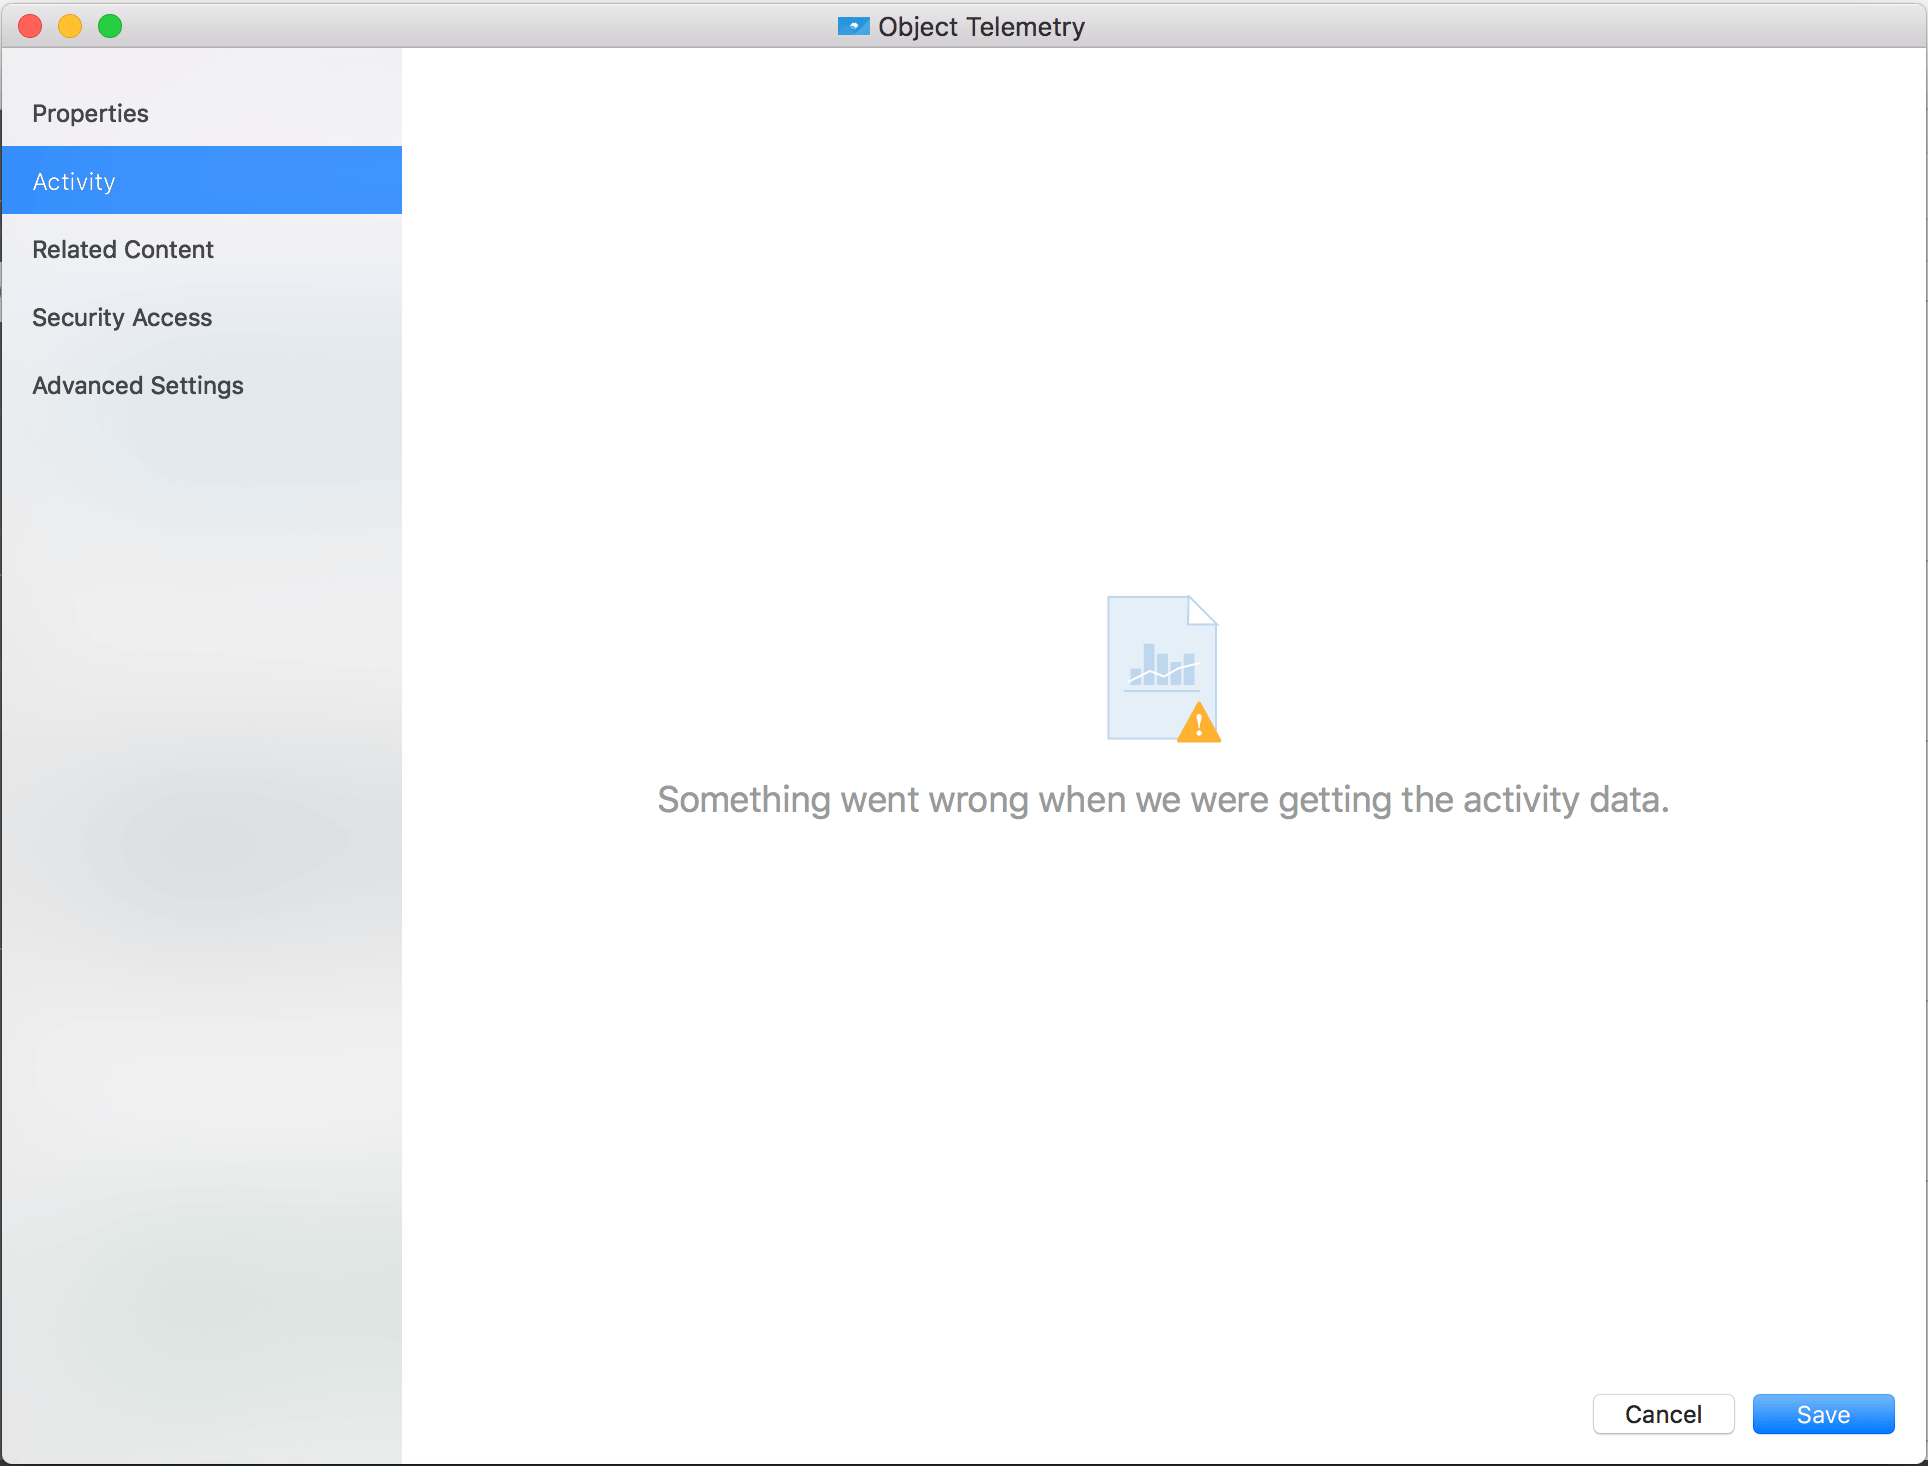
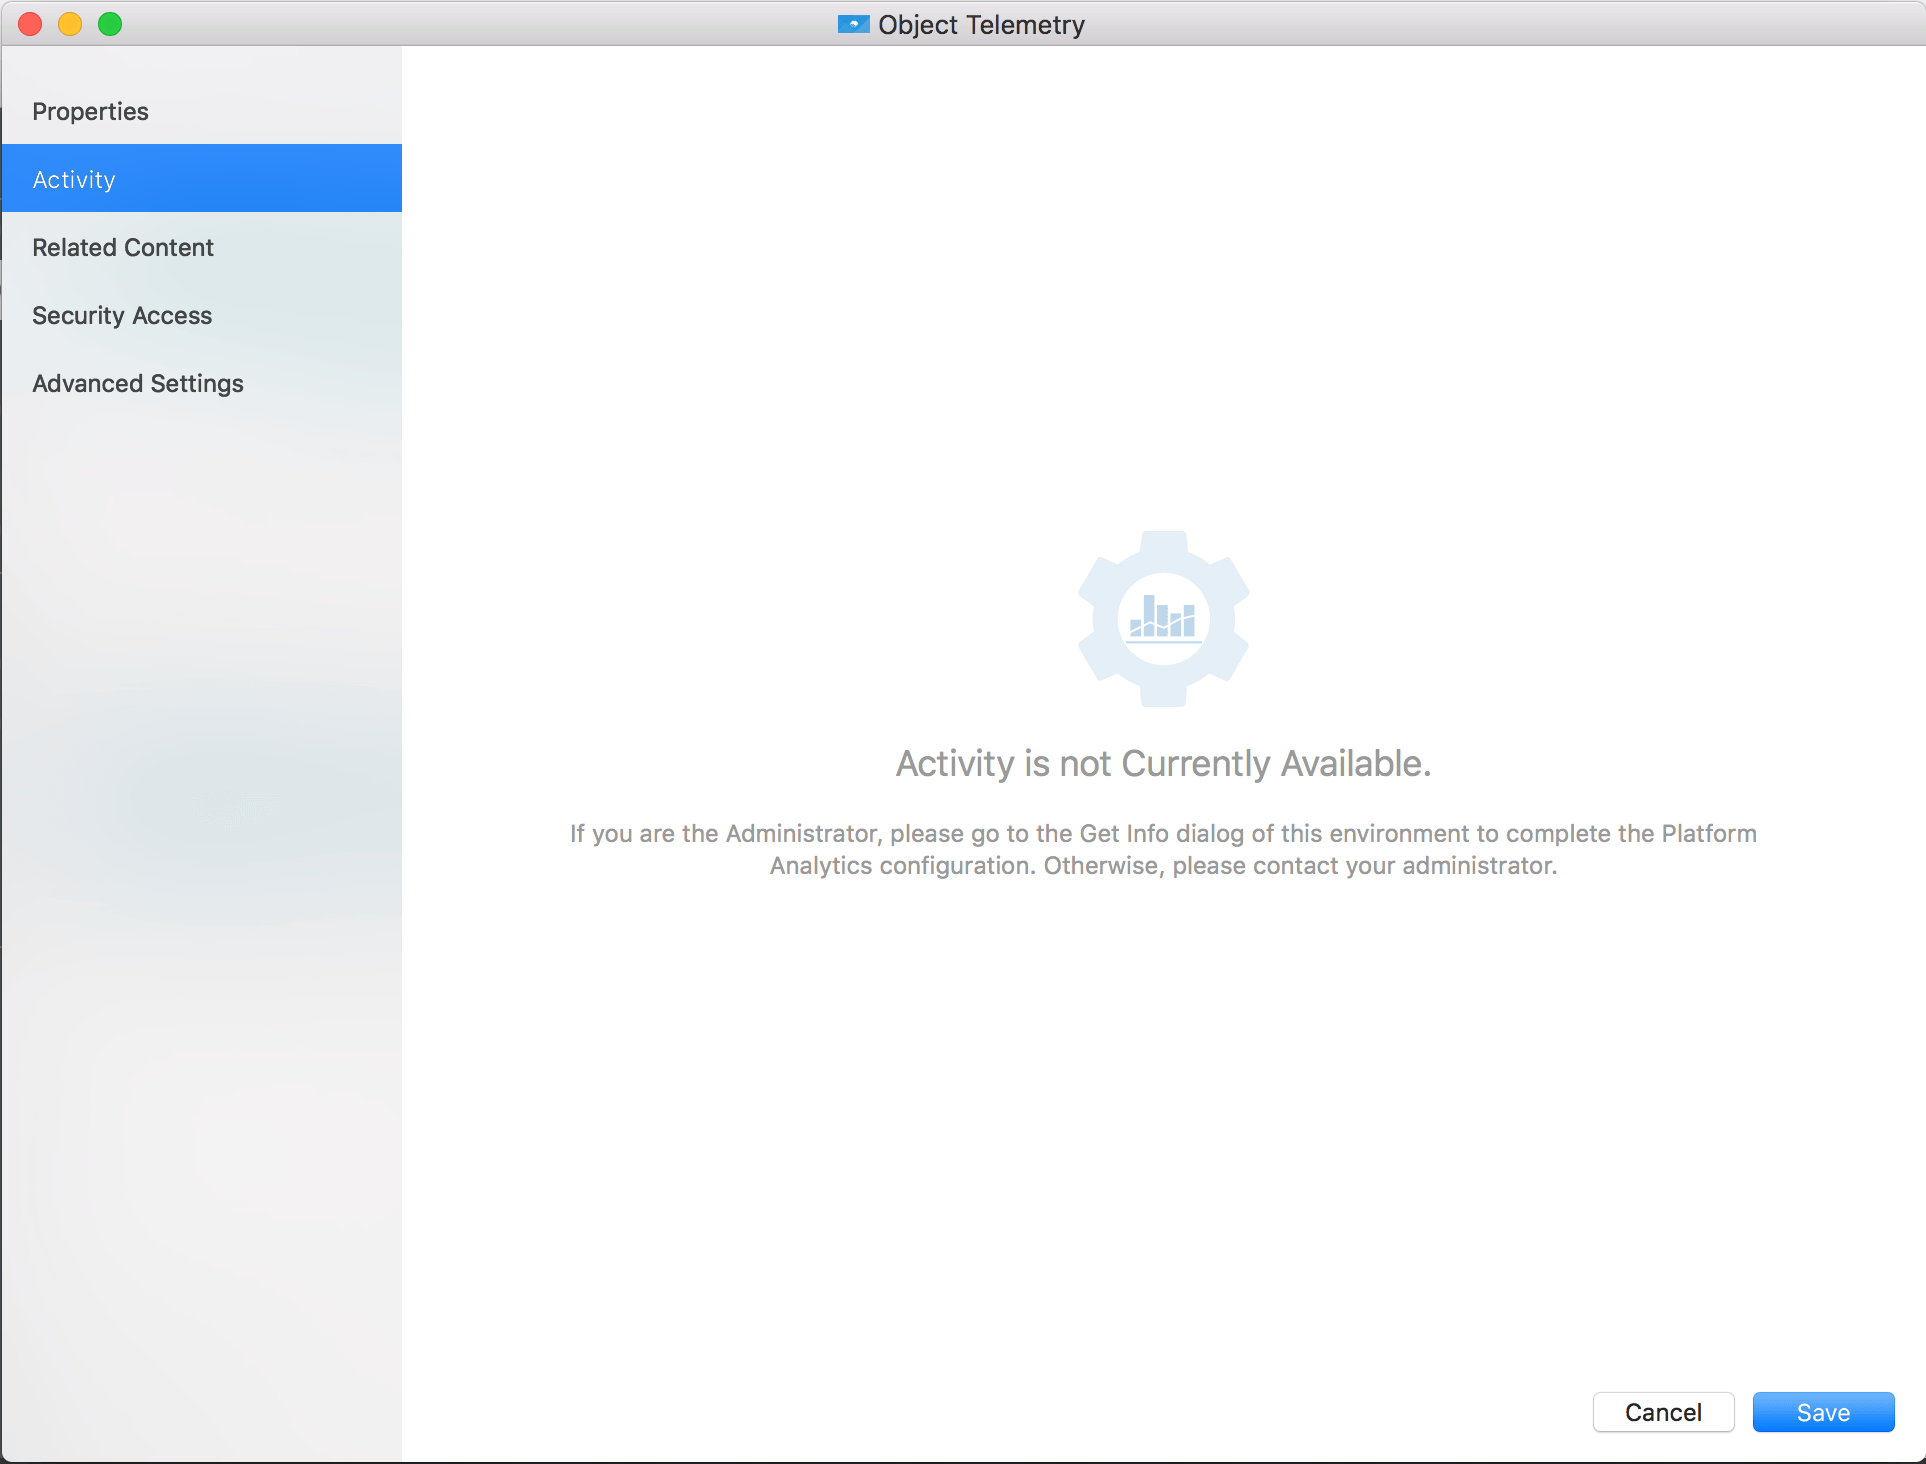
Improved Error Handling in 11.1
API Error
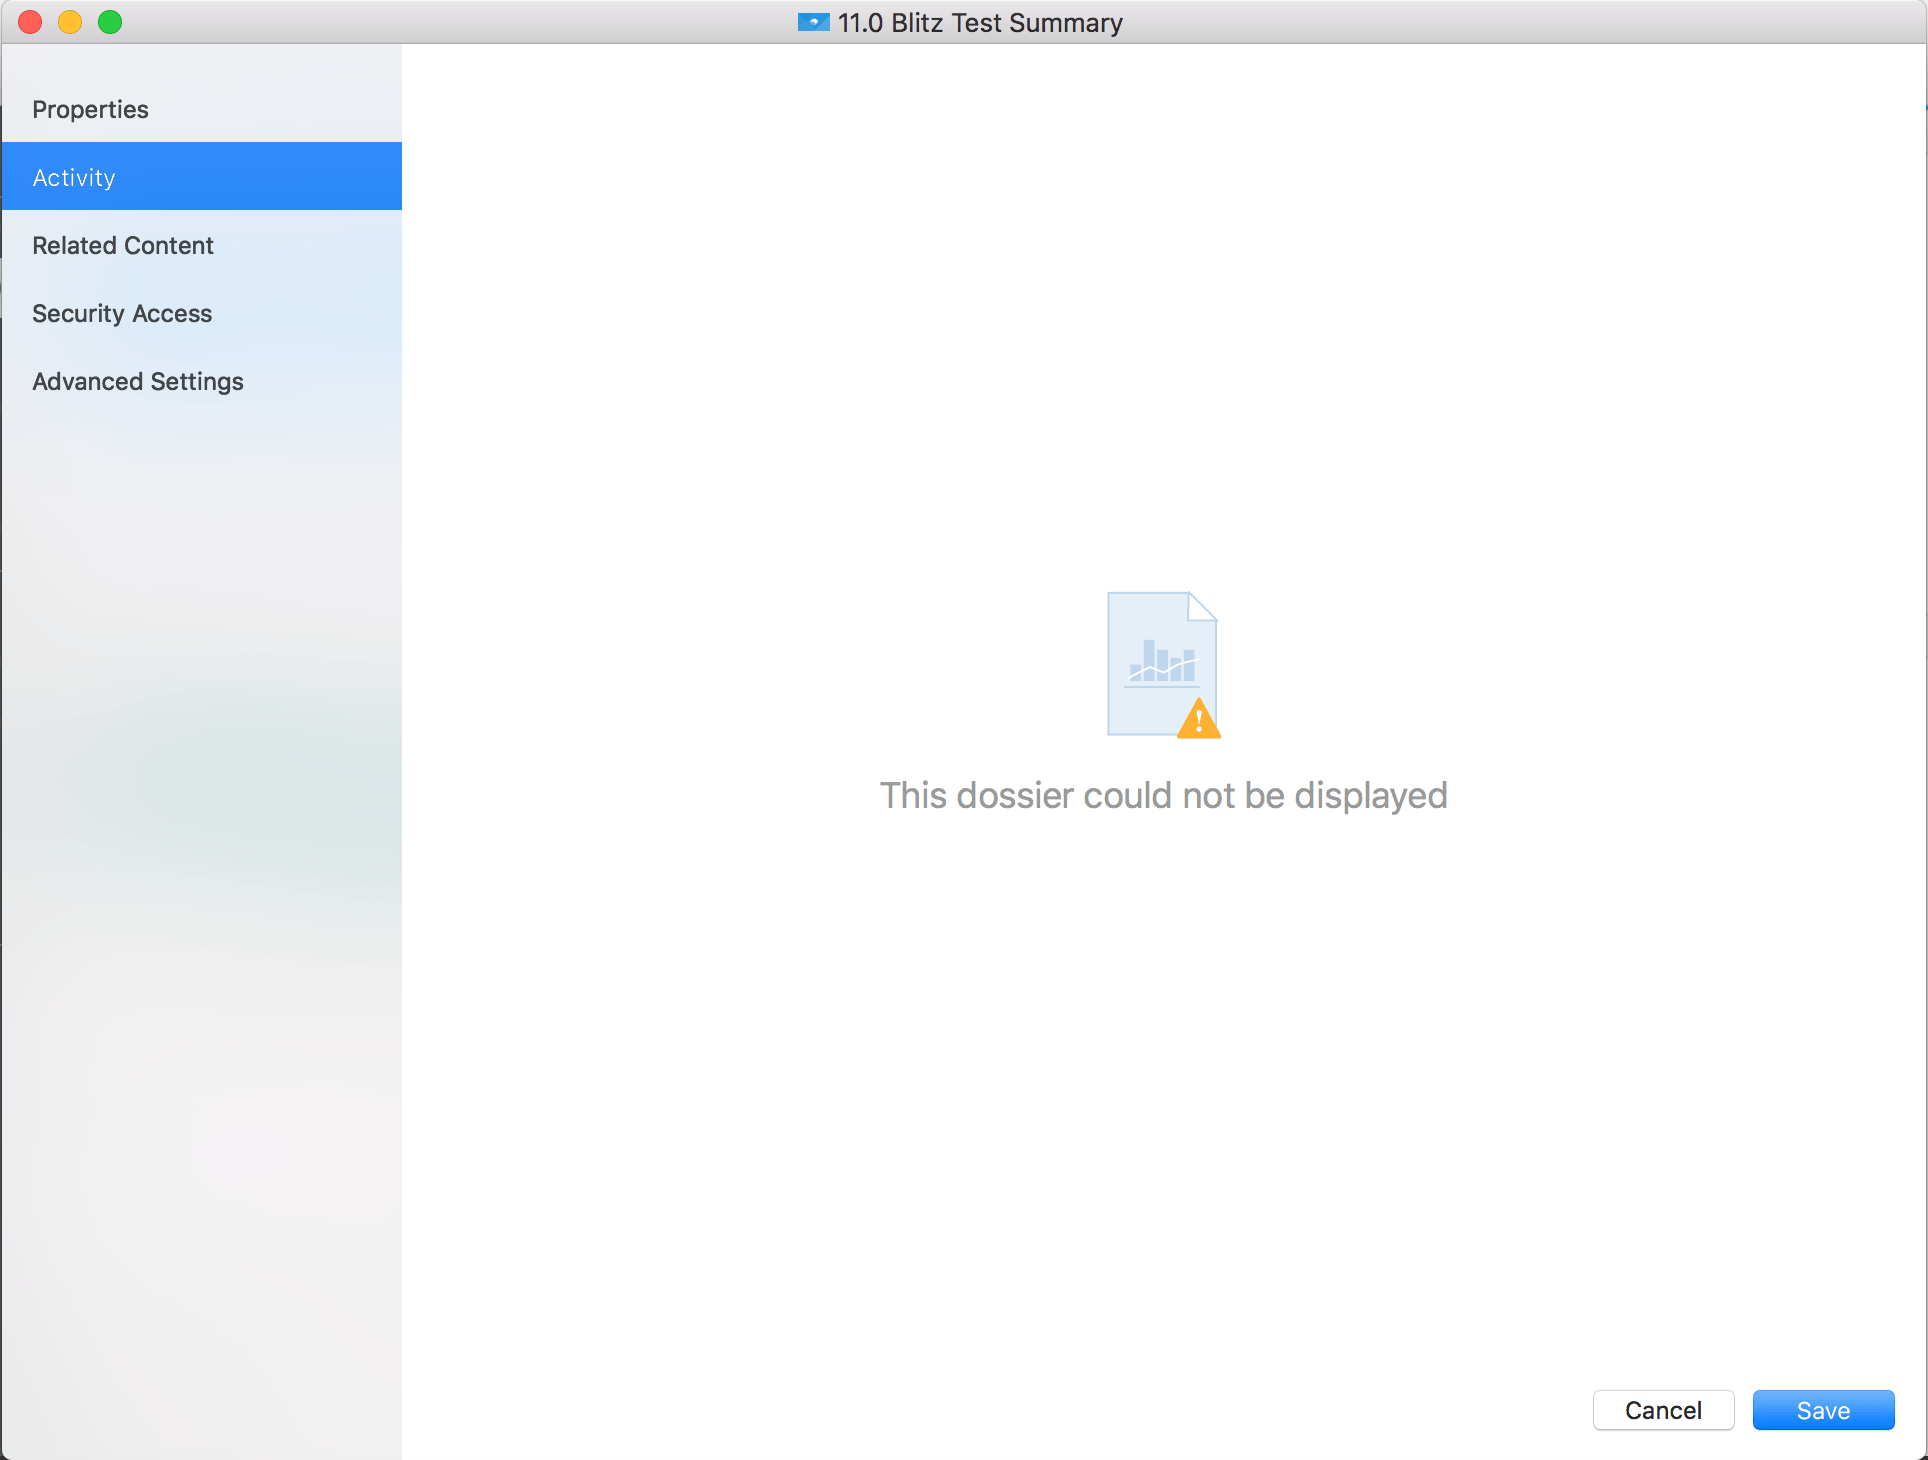
  1. Current environment is not up-to-date
  2. Embedded SDK is unavailable

ka0PW0000001JWLYA2_0EM44000000RRUu.png

No available PA environment
Current environment does not have a valid Platform Analytics application
ka0PW0000001JWLYA2_0EM44000000RRUk.png

Library shows an error

ka0PW0000001JWLYA2_0EM44000000RRUz.png

 
Additional Resources
 
Platform Analytics FAQ


Comment

0 comments

Details

Knowledge Article

Published:

December 7, 2018

Last Updated:

March 21, 2024