Starting with the release of Strategy ONE (March 2024), dossiers are also known as dashboards.
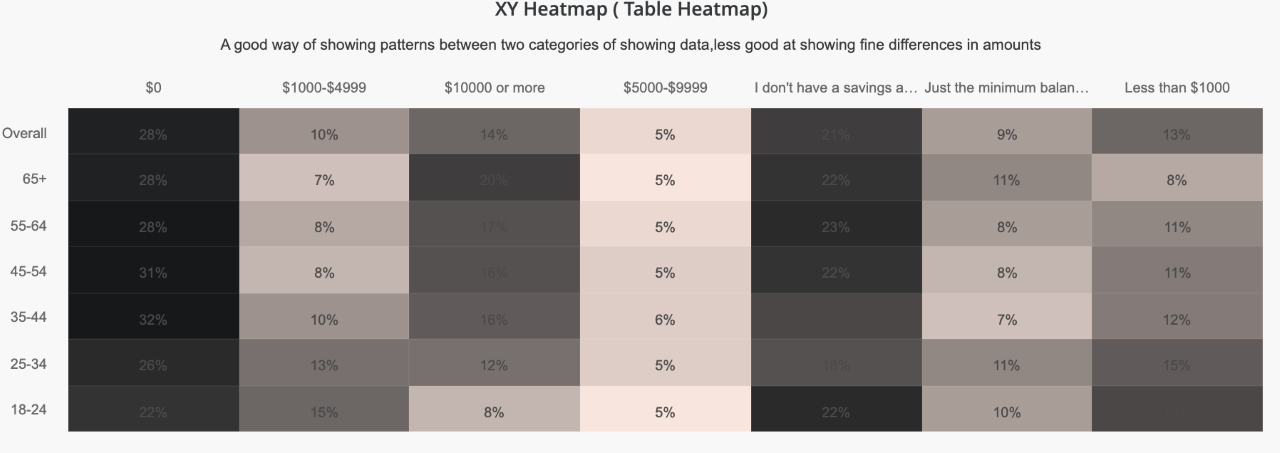
An XY Heatmap (also known as a Table Heatmap) is an effective and intuitive visualization for showing the relationships between two attributes. The color and/or shade of each box in the XY Heatmap enables the user to understand the correlation of the data quickly. Unlike the Tree Heatmap, each box in the XY Heatmap is equally sized, which makes it a less effective visualization for showing magnitude.
Requirements
Attributes -1 (minimum)
Metrics -1
Strategy 10.4 or higher with VitaraCharts
Strategy Features
Vitaracharts is now FREE for Desktop and Workstation.
Please contact sales@vitaracharts.com to get a 30-day trial key.
Take note that this visual is a part of the VitaraCharts library.
Download visualizations: www.vitaracharts.com
Online interactive visualizations can be accessed here: https://cloud.vitaracharts.com
Publisher: Vitara
Vitara is a Strategy technology partner and offers a fully supported, production-ready chart plugin (VitaraCharts) with 30+ stunning visualizations to enhance Strategy analytics. All Vitara visualizations are customizable and supported through upgrades for a hassle-free experience. We perform extensive testing for backward compatibility with all currently certified versions of Strategy and also ensure all new versions of Strategy are tested and supported across all charts.
For more details please contact sales@vitaracharts.com or www.vitaracharts.com.