Student | Test | Score |
1 | 101 | 20 |
1 | 102 | 50 |
1 | 103 | 47 |
1 | 104 | 78 |
1 | 101 | 83 |
1 | 201 | 62 |
1 | 202 | 92 |
1 | 203 | 79 |
1 | 204 | 88 |
1 | 301 | 57 |
Student | Test | Score | Rank | Percentile Rank |
1 | 101 | 20 | 0 | 0 |
1 | 103 | 47 | 1 | 11.11 |
1 | 102 | 50 | 2 | 22.22 |
1 | 301 | 57 | 3 | 33.33 |
1 | 201 | 62 | 4 | 44.44 |
1 | 203 | 78 | 5 | 55.56 |
1 | 104 | 79 | 6 | 66.67 |
1 | 101 | 83 | 7 | 77.78 |
1 | 204 | 88 | 8 | 88.89 |
1 | 202 | 92 | 9 | 100 |
n = 9
P = 0.70
Rank1 = 6 @ 66.67
Rank2 = 7 @ 77.78
[(0.7 * 9) - 6] / [7 - 6] = [x - 79] / [83 - 79]
x = 80.2
When the analytical engine sees multiple values for the same dataset, it will pick the first value that its reads from the data set and apply it to the remaining calculations - in this case the rank and percentile calculations. This can be seen if a report is generated in MicroStrategy showing the rank and percentage rank calculated as shown below. Note that there are only eight ranks in the calculated set as opposed to the nine ranked elements in the raw data as shown above:

NOTE: The values calculated by the analytical engine are correct if the user would like that the fact data be grouped for the percentile metric calculation
ACTION:
The steps to achieve this are explained with the same example described above:

Now create the 'Score' metric at a dimensionality that includes the 'Score' level, as shown below. This will force the analytical engine to consider the uniqueness of the score data.

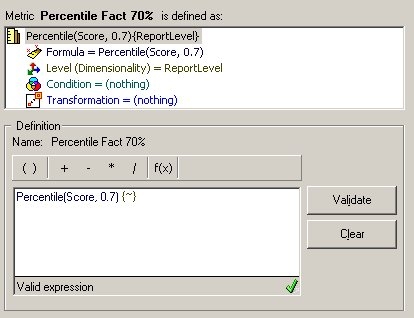
The schema will need to be updated to use the new dimensionality. Now simply create a Percentile metric based off this dimensional metric, as shown below

Now using this metric in a report will return the correct results, as shown below

