EducationSoftwareStrategy.com
StrategyCommunity

Knowledge Base

Product

Community

Knowledge Base

TopicsBrowse ArticlesDeveloper Zone

Product

Download SoftwareProduct DocumentationSecurity Hub

Education

Tutorial VideosSolution GalleryEducation courses

Community

GuidelinesGrandmastersEvents
x_social-icon_white.svglinkedin_social-icon_white.svg
Strategy logoCommunity

© Strategy Inc. All Rights Reserved.

LegalTerms of UsePrivacy Policy
  1. Home
  2. Topics

KB485003: Platform Analytics dossiers show the same hour (12:00 AM) in the Last Execution Timestamp column


Wojciech Wloch

Manager, Professional Services • Strategy


This article explains why the Platform Analytics dossiers show the same hour in the Last Execution Timestamp column. This article also provides a solution to avoid this behavior.

Starting with the release of Strategy ONE (March 2024), dossiers are also known as dashboards.

Description 


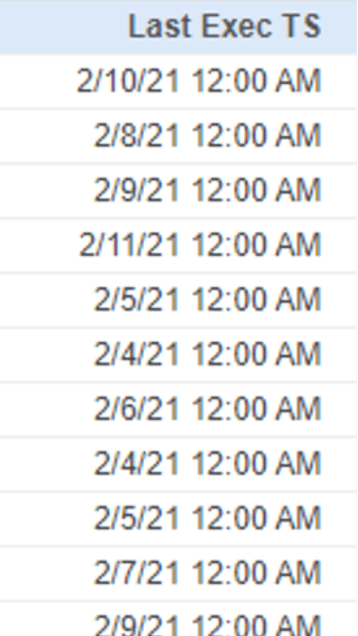
The timestamp in out-of-the-box (OOTB) Platform Analytics dossiers is incorrectly displayed. Platform Analytics dossiers alway show the same hour (12:00 AM) in the Last Execution Timestamp column. However, the values are correct in the Platform Analytics warehouse when you query the fact_access_transactions_view table directly.
 

ka0PW0000001JfzYAE_0EM4W0000027bTz.jpeg

Why is this happening? 


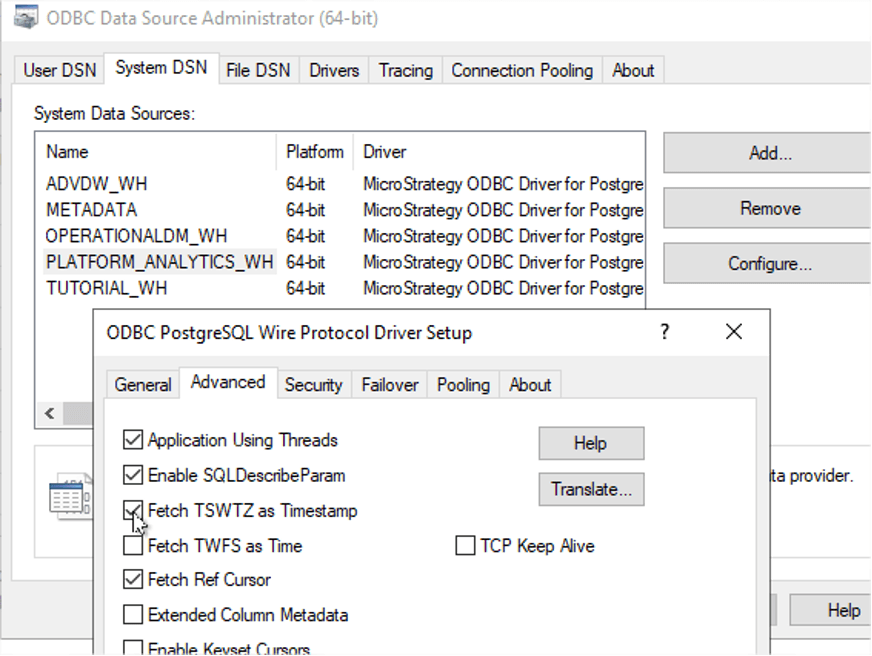
The DSN setting for the Platform Analytics warehouse is missing one parameter. 
Solution 

On Windows

  • Modify the Platform Analytics DSN to enable Fetch TSWTZ as Timestamp. 
ka0PW0000001JfzYAE_0EM4W0000027bge.jpeg
  • Restart the Intelligence server.
  • Republish the Platform Analytics cube.

On Linux

  1. Open the
    odbc.ini
    file. 
  2. Add
    FetchTSWTZasTimestamp=1
    to the
    PLATFORM_ANALYTICS_WH
    section. 
    
    [PLATFORM_ANALYTICS_WH]
    ApplicationUsingThreads=1
    AlternateServers=
    Description=Strategy ODBC Driver for PostgreSQL Wire Protocol
    FailoverPreconnect=0
    FetchTWFSasTime=1
    Driver=/opt/mstr/MicroStrategy/install/lib/MYpsqlXX.so
    ConnectionRetryDelay=3
    EnableDescribeParam=1
    InitializationString=
    FetchRefCursors=1
    Database=platform_analytics_wh
    QueryTimeout=0
    HostName=10.250.149.169
    FetchTSWTZasTimestamp=1
    ReportCodePageConversionErrors=0
    FailoverMode=0
    LoadBalancing=0
    ConnectionRetryCount=0
    ExtendedColumnMetaData=0
    XMLDescribeType=-10
    LoginTimeout=15
    TransactionErrorBehavior=0
    FailoverGranularity=0
    PortNumber=5432
    LogonID=postgres
    

  3. Restart the Intelligence server.
  4. Republish the Platform Analytics cube.

Comment

0 comments

Details

Knowledge Article

Published:

April 22, 2021

Last Updated:

March 21, 2024