Starting with the release of Strategy ONE (March 2024), dossiers are also known as dashboards.
Understanding your data characters and choosing the matched configuration could enhance performance and accelerate the process of viewing the latest data. The following key areas are covered in this article:
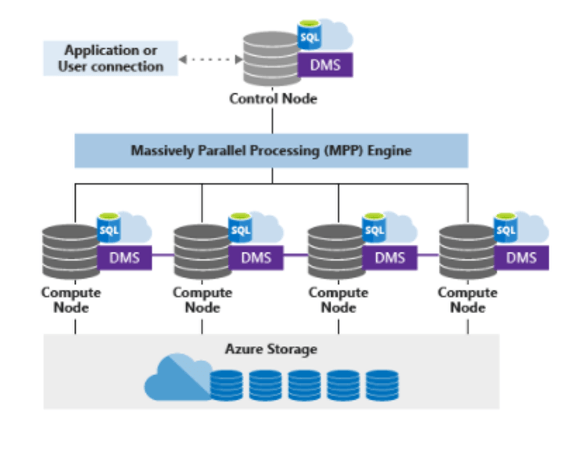
Synapse Analytics leverages a scale out architecture to distribute computational processing of data across multiple nodes. Computation is separate from storage, which enables you to scale computation resources independently of the data storage in your system.
A distributed table appears as a single table, but the rows are stored across 60 distributions. The rows are distributed using a hash or round-robin algorithm.
A hash-distributed table can deliver the highest query performance for joins and aggregations for large tables. To shard data into a hash-distributed table, a dedicated SQL pool uses a hash function to deterministically assign each row to each distribution. In the table definition, one of the columns is designated as the distribution column. The hash function uses the values in the distribution column to assign each row to a distribution.
The following diagram illustrates how a full (non-distributed table) gets stored as a hash-distributed table.
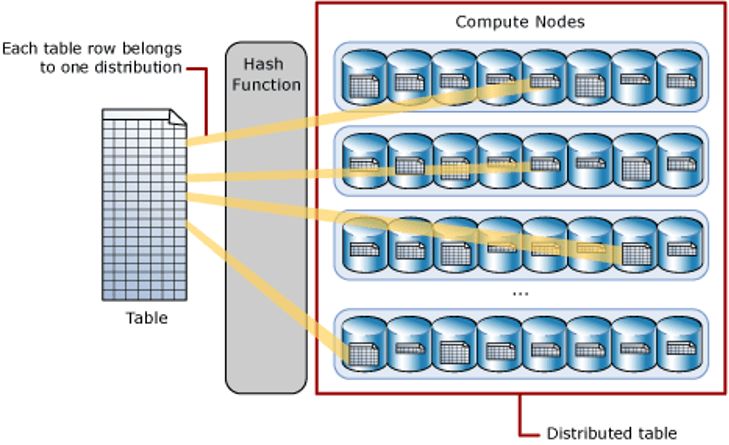
There are performance considerations for the selection of a distribution column, such as distinctness, data skew, and the types of queries that are frequently executed in the system.
A round-robin table is the simplest table to create and delivers fast performance when used as a staging table.
A round-robin distributed table distributes data evenly across the table without any further optimization. A distribution is first chosen at random and then buffers of rows are assigned to distributions sequentially. It is quick to load data into a round-robin table, but query performance can often be better with hash distributed tables. Joins on round-robin tables require data reshuffling, which takes additional time.
Round-robin is also the default algorithm we used to generate temporary tables in multi-pass SQL generated in Strategy.
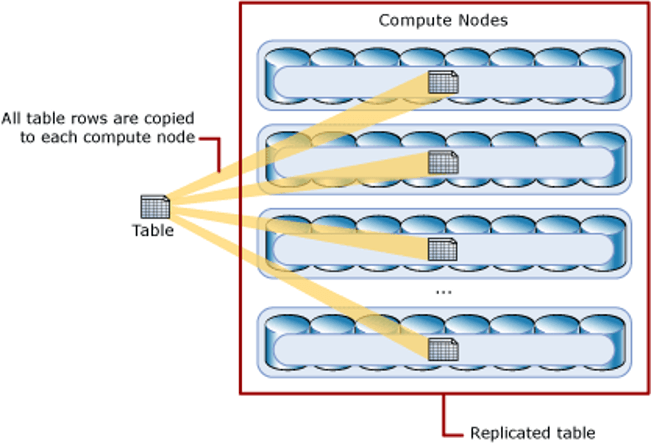
A table that is replicated caches a full copy of the table on each compute node. Consequently, replicating a table removes the need to transfer data among compute nodes before a join or aggregation. Replicated tables are best utilized for small tables. Extra storage is required and there is additional overhead when writing data, which makes this option impractical for large tables.
The diagram below shows a replicated table that is cached on the first distribution on each compute node.
What happens before tuning?
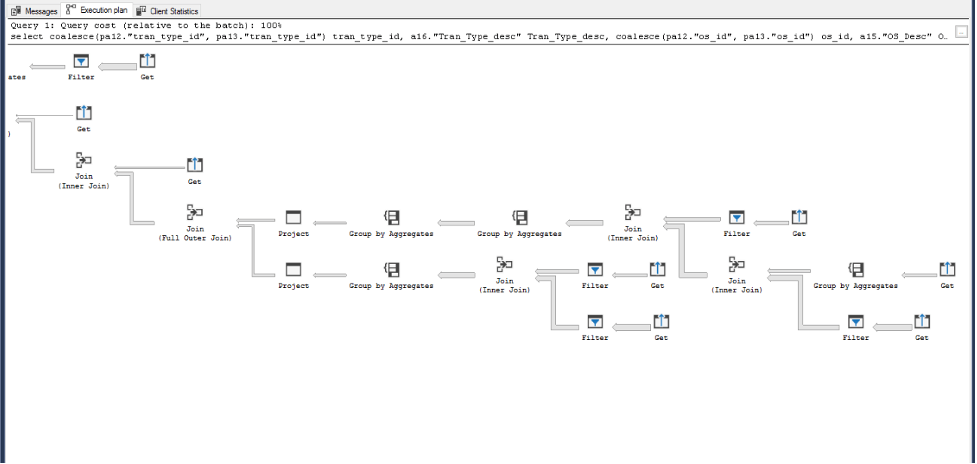
We collected the SQL queries against Warehouse in an in-house Universal Benchmark test. From the estimated execution plan of those queries, we found 99% of time is spent on Shuffle actions.
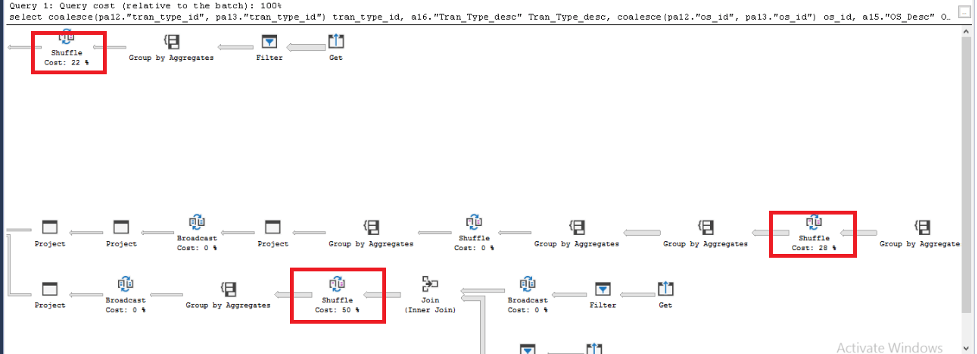
When creating tables, Synapse SQL supports three methods for distributing data, round-robin, hash and replicated.
The default distributing method is round-robin. Loading data into a round-robin table is fast. However, queries can require more data movement than the other distribution methods. When querying the table in this distribution method, it leads to the Shuffle actions in the execution plan.
Solution
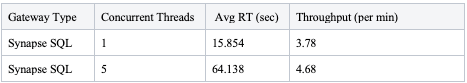
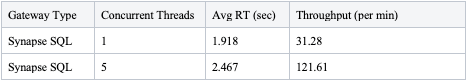
To avoid the Shuffle actions, we can change the table distributing method from round-robin to replicated. After the change, Data Shuffle actions disappeared from the execution plan. The single query performance improved from 10 seconds to 0.6 second.
Universal Benchmark for dataset with round-robin algorithm:
Universal Benchmark for dataset adjusted to replicated algorithm:
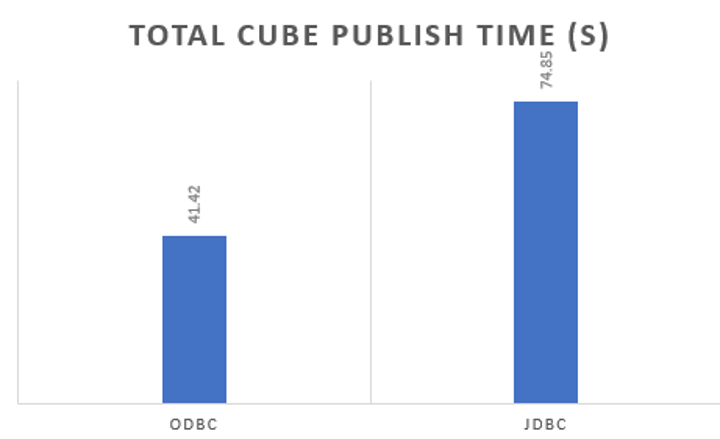
Azure Synapse Analytics share the same drivers as Microsoft SQL Server, both ODBC (Open database connectivity) and JDBC (Java Database Connectivity) drivers are shipped out of the box with Strategy. From the results of single cube publish testing which records and compares the time spent on a single cube (4M rows) republish, we suggest our customers use ODBC instead of JDBC.
Here is the time spent comparison of 2 drivers, ODBC is faster than JDBC driver by 80%.
*Shipped driver refers to the Data Direct driver which is installed with Strategy Intelligence Server
*Native driver refers to Microsoft SQL Server driver
We suggest our customers use shipped drivers in regular use cases to get more integrated and thorough support since we have a fully certified shipped driver from all aspects including connectivity, functionality, security, and performance.
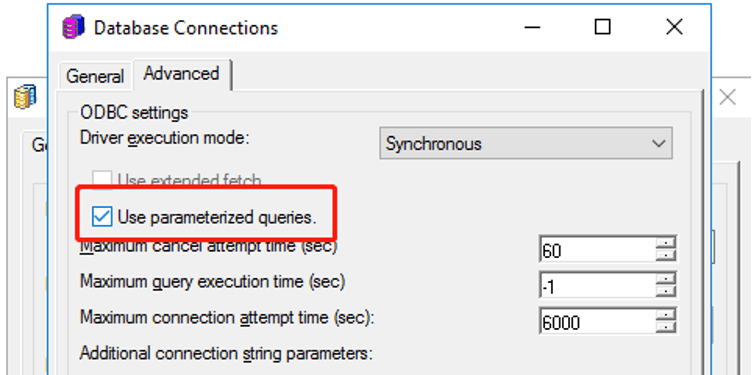
The feature is by default turned off for Azure Synapse Analytics due to known functionality limitation in OOTB ODBC driver.
If a customer needs to turn on Parameterize Query manually, we suggest using the JDBC driver or switching to Microsoft SQL Server driver if customer sees some functional defects. For details, please refer to KB484544.
Parameterized queries are SQL queries that can use placeholders for data. Using placeholders allows these queries to be re-used. The following is an example of a parameterized query:
select	distinct [a11].[CUSTOMER_ID]  [CUSTOMER_ID],
	CONCAT([a11].[CUST_LAST_NAME], [a11].[CUST_FIRST_NAME])  [CustCol_12]
from	[lu_customer]	[a11]
where	CONCAT([a11].[CUST_LAST_NAME], [a11].[CUST_FIRST_NAME]) like ?
with parameters:
	%?%
INSERT INTO DMTABLE (Customer_ID, Customer_Name) VALUES (?, ?)
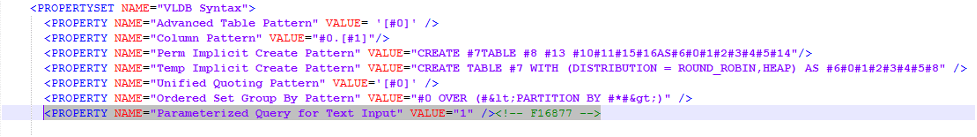
The feature enabling is controlled by a VLDB property included in the
DATABASE.PDSfile.
<PROPERTY NAME="Parameterized Query for Text Input" VALUE="1" /><!-- F16877 -->
<VLDB Select>section like:
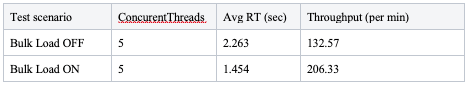
To take full advantage of “Bulk Insert," the
EnableBulkLoadparameter must be included in the DSN (Data Source Name) when using Data Direct drivers, the parameter can be added in different clients.
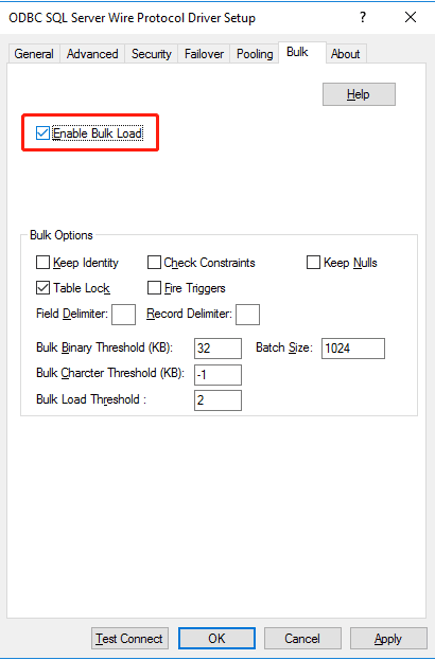
EnableBulkLoad=1” in
odbc.ini:
[ODBC Data Sources]
SynapseSQLSample=Strategy ODBC Driver for SQL Server Wire Protocol

[SynapseSQLSample]
Description=Strategy ODBC Driver for SQL Server Wire Protocol
Driver=MYsqls64.so
Database=<database>
HostName=<servername>
PortNumber=<port>
DoubleToStringPrecision=17
EncryptionMethod=1
ValidateServerCertificate=0
EnableQuotedIdentifiers=1
EnableBulkLoad=1
EnableBulkLoad=1” in the JDBC connection string.
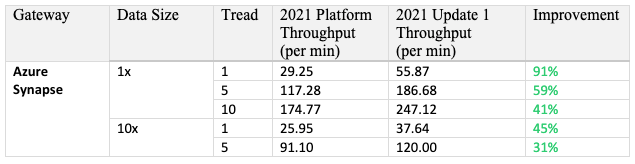
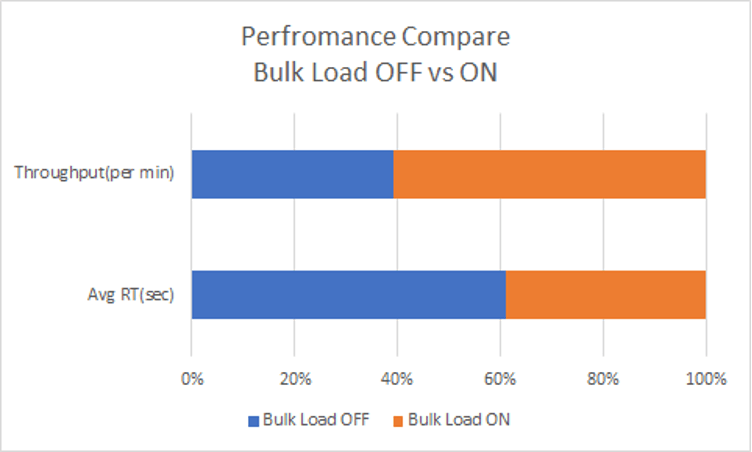
With all above configured, the total performance measured by Universal Benchmark performance testing can be improved by 70%, average response time shorten by 35%.

Strategy 2020 introduces a new feature that will apply the correct quotes to all identifiers. For Azure Synapse Analytics, square brackets [#0] are used in SQL generation. The following is a sample SQL:
select	[a11].[badge_id]  [badge_id_bigint],
	[a11].[Badge_Name]  [Badge_Name]
from	[idm_intel2].[badge]	[a11]
where	(([a11].[badge_id])
 in	(select	[s23].[badge_id]
	from	[idm_intel2].[LU_BD_HISTORY]	[s22]
		join	[idm_intel2].[REL_BADGE_BDHISTORY]	[s23]
		  on 	([s22].[bd_history_id] = [s23].[bd_history_id])
	where	[s22].[directorate_id] in (40)))
With each product release improvements and enhancements made to the Strategy Analytical Engine can cause minor changes in the data returned when executing dossiers and documents. The default engine version of Strategy 2021 is AE13. For more details, see Data Engine changes in MicroStrategy 2021 release.
For example, with AE version 12 and above, Strategy push filters down to database for execution to minimize the intermediate results set size. This pushdown can significantly improve the performance of dossier execution.
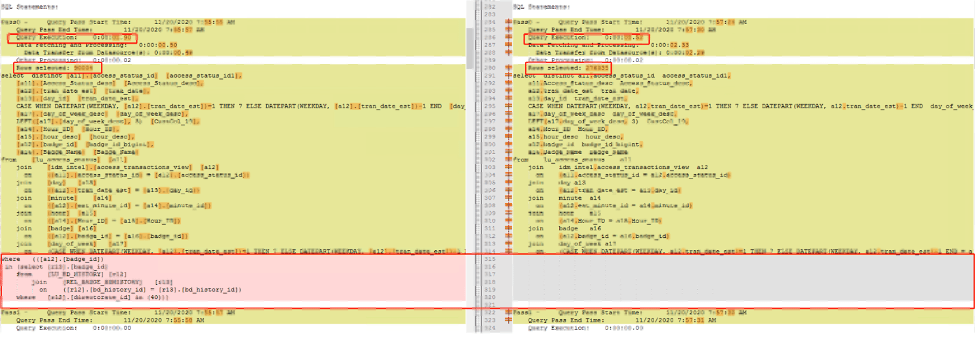
Here is the SQL comparison of 2 engine version, the left query (AE13) push filters after where clause in pervious pass and the result set in finally execution decrease from 276335 to 90004.
For details, see KB483573: Metric Qualification Filter not Push Down in ConnectLive leads to performance degrading.
The following case is designed to illustrate the benefit from cache management. Skip this part if caching is managed by the gateway automatically.
There is no specific cache management enhancement against Azure Synapse Analytics.
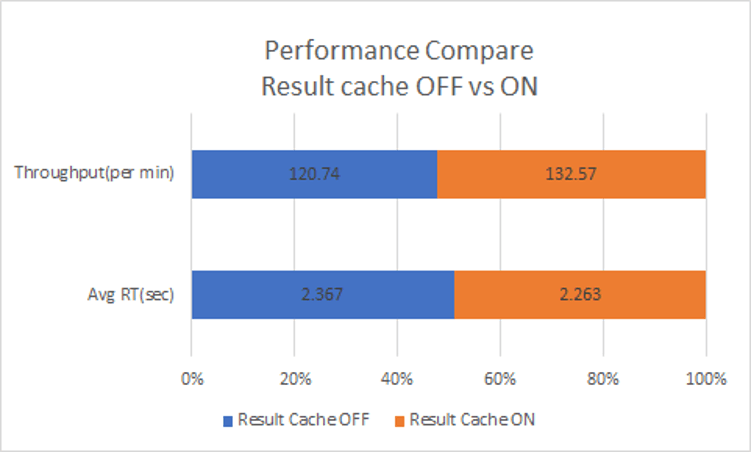
When result set caching is enabled, Synapse Analytics automatically caches query results in the user database for repetitive use. This allows subsequent query executions to get results directly from the persisted cache, so query execution is not needed. Result set caching improves query performance and reduces compute resource usage. In addition, queries using cached results set do not use any concurrency slots and thus do not count against existing concurrency limits. For security, users can only access the cached results if they have the same data access permissions as the users creating the cached results.
Run this query for the time taken by result set caching operations for a query:
SELECT step_index, operation_type, location_type, status, total_elapsed_time, command
FROM sys.dm_pdw_request_steps
WHERE request_id  = <'request_id'>;
Here is an example output for a query executed with result set caching enabled.

With Result cache enabled, the total dossier execution performance increased by 10% (Measured by Universal Benchmark Performance Test).
A data warehouse workload refers to all operations that are transpired in relation to a data warehouse. The depth and breadth of these components depends on the maturity level of the data warehouse. The data warehouse workload encompasses:
The performance capacity of a data warehouse is determined by the data warehouse units.
SQL pool uses resource groups to allocate memory to queries. Out of the box, all users are assigned to the small resource class, which grants 100 MB of memory per distribution. Since there are always 60 distributions and each distribution is given a minimum of 100 MB, system wide the total memory allocation is 6,000 MB, or just under 6 GB.
Certain queries, like large joins or loads to clustered columnstore tables, will benefit from larger memory allocations. Some queries, like pure scans, will yield no benefit. However, utilizing larger resource classes reduces concurrency, so you will want to take this impact into consideration before moving all your users to a large resource class.
If you notice that user queries have a long delay, it could be that your users are running in larger resource classes and are consuming many concurrency slots causing other queries to queue up. To see if users’ queries are queued, run
SELECT * FROM sys.dm_pdw_waitsto see if any rows are returned.
The Strategy platform provides VLDB settings for all supported RDBMS platforms to generate optimized SQL that takes advantage of database-specific functionality.
This setting can reduce the number of SQL passes generated by Strategy. In Strategy, SQL Global Optimization reduces the total number of SQL passes with the following optimizations:
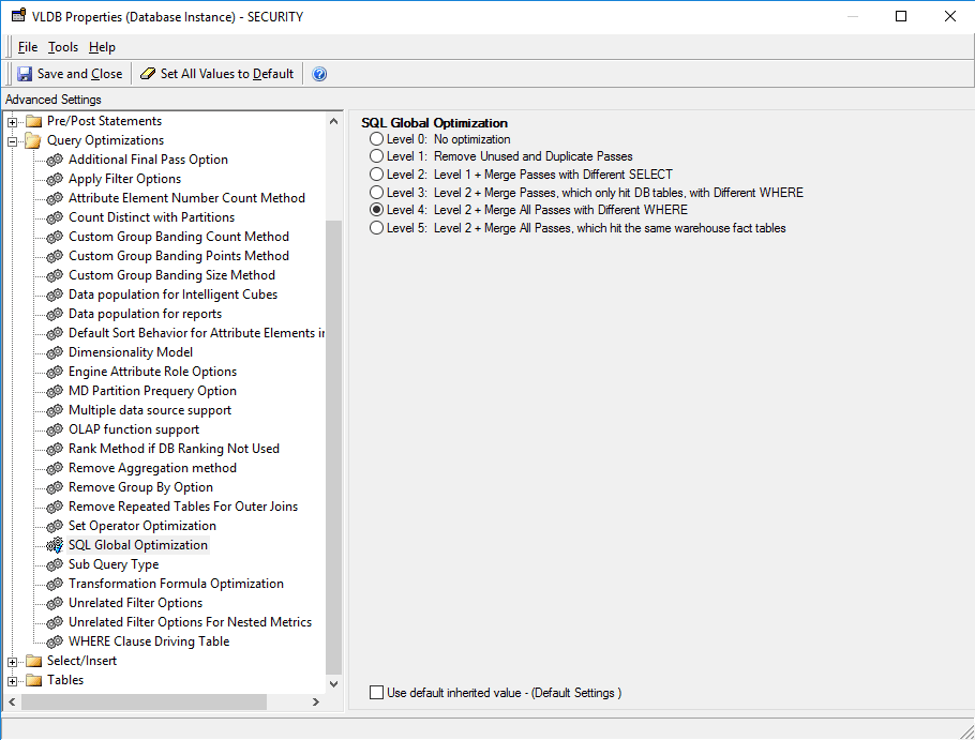
The default setting for Synapse SQL is to enable SQL Global Optimization at its highest level.
This setting is used to combine multiple subqueries into a single subquery using set operators (e.g., UNION, INTERSECT, EXCEPT). However, there is no significant improvement against Synapse Analytics. The default value for Synapse Analytics is to disable Set Operator Optimization.
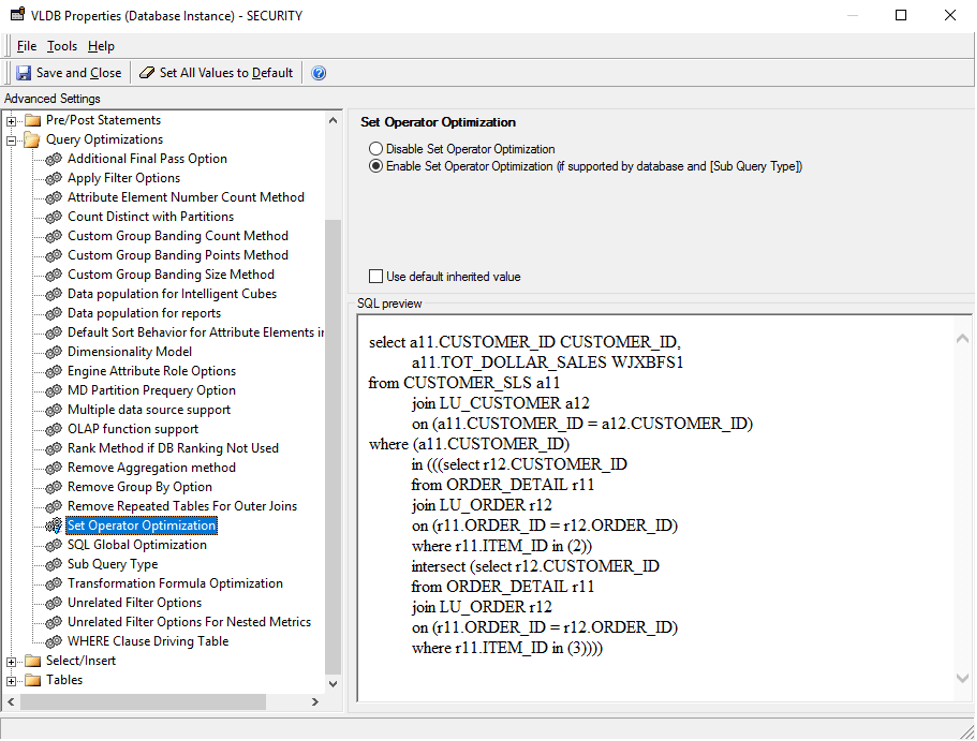
If you manually enable this setting. The following is an example of SQL command after enabling the setting.
select a13.CATEGORY_ID CATEGORY_ID,
       max(a14.CATEGORY_DESC) CATEGORY_DESC,
       sum(a11.TOT_UNIT_SALES) WJXBFS1
from ITEM_EMP_SLS a11
       join LU_ITEM a12
        on (a11.ITEM_ID = a12.ITEM_ID)
       join LU_SUBCATEG a13
        on (a12.SUBCAT_ID = a13.SUBCAT_ID)
       join LU_CATEGORY a14
        on (a13.CATEGORY_ID = a14.CATEGORY_ID)
where (a11.EMP_ID)
in (((select r11.EMP_ID
       from ITEM_EMP_SLS r11
       where r11.ITEM_ID = 37)
except (select r11.EMP_ID
       from ITEM_EMP_SLS r11
       where r11.ITEM_ID = 217)))
       group by a13.CATEGORY_ID
There are many cases in which the SQL Engine generates subqueries (e.g., query blocks in the WHERE clause):
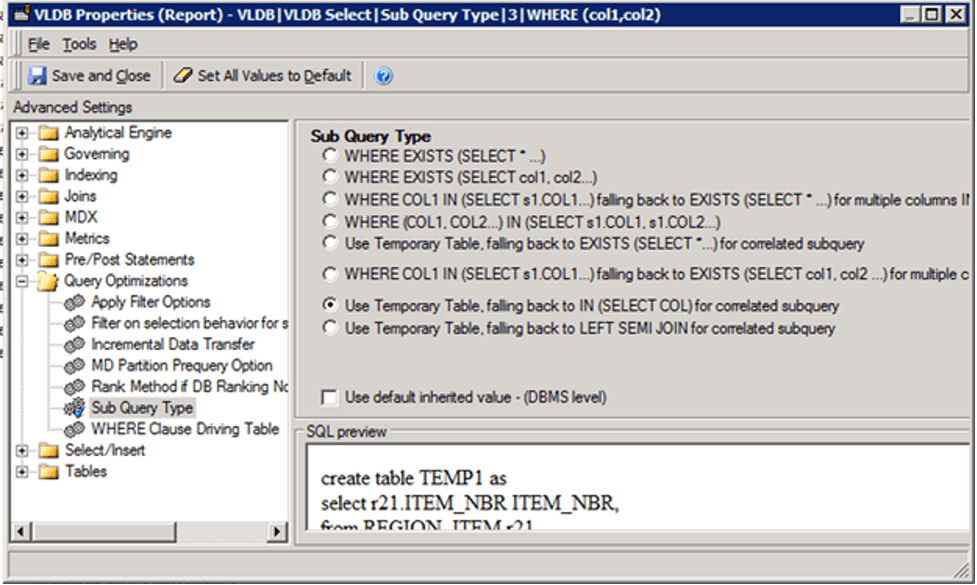
The default setting for Sub Query Type for Teradata is Option 2 – “WHERE EXISTS (SELECT col1, col2…)”. This setting instructs the SQL Engine to generate a subquery in the WHERE clause with the Exist clause.
select [a11].[badge_id] [badge_id_bigint],
[a11].[Badge_Name] [Badge_Name]
from [idm_intel2].[badge] [a11]
where (exists (select [s23].[badge_id]
from [idm_intel2].[LU_BD_HISTORY] [s22]
join [idm_intel2].[REL_BADGE_BDHISTORY] [s23]
on ([s22].[bd_history_id] = [s23].[bd_history_id])
where [s22].[directorate_id] in (40)
and [s23].[badge_id] = [a11].[badge_id]))
select [a11].[badge_id] [badge_id_bigint],
[a11].[Badge_Name] [Badge_Name]
from [idm_intel2].[badge] [a11]
where (([a11].[badge_id])
in (select [s23].[badge_id]
from [idm_intel2].[LU_BD_HISTORY] [s22]
join [idm_intel2].[REL_BADGE_BDHISTORY] [s23]
on ([s22].[bd_history_id] = [s23].[bd_history_id])
where [s22].[directorate_id] in (40)))
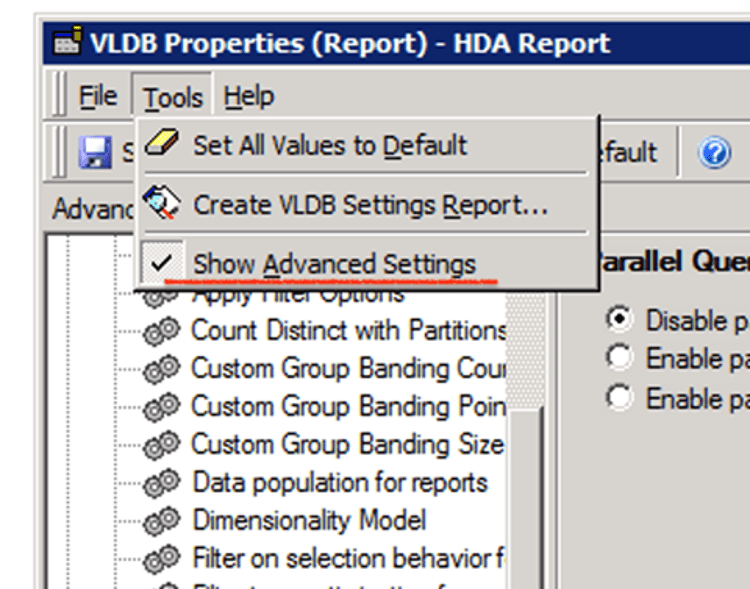
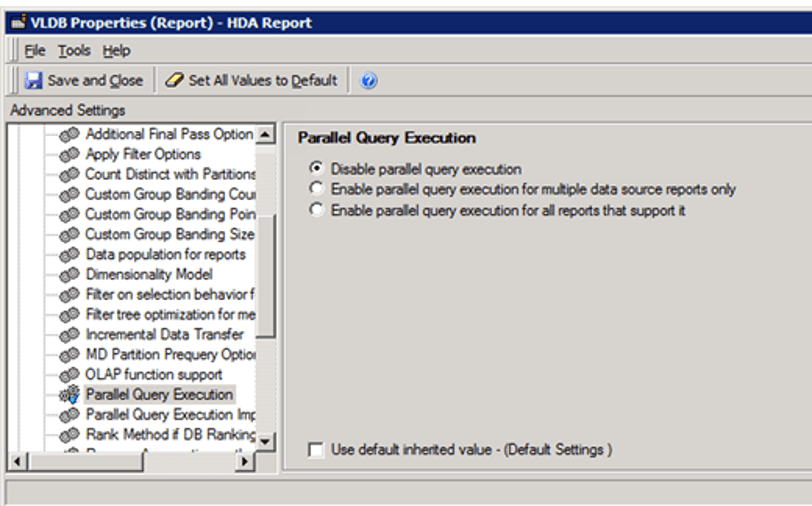
The Parallel Query Execution is an advanced property which determines whether Strategy attempts to execute multiple queries in parallel to return report results faster and publish Intelligent cubes.
Turn on/off the Parallel Execution on project level or report level: Query Optimization > Parallel Query Execution.
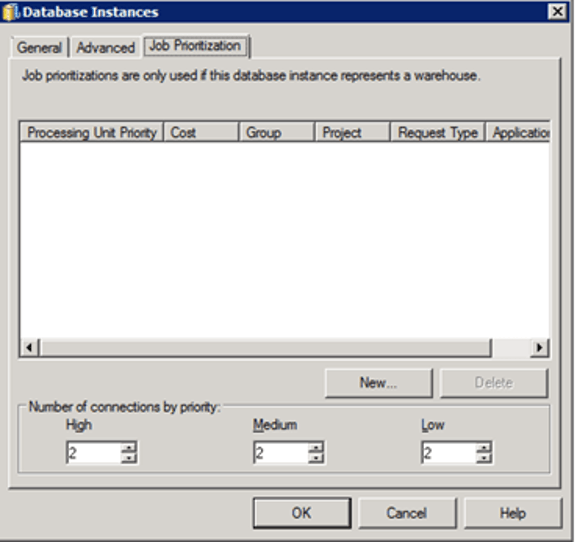
Administrators can, based on priority, specify the number of warehouse connections that are required for efficient Job processing. There are three priorities for a Job: high, medium, and low.
Administrators are not required to set medium and high connections, but must set at least one low connection, because low priority is the default Job priority.
The optimal number of connections is dependent on several factors, however the main criterion to consider when setting the number of connections is the number of concurrent queries the Warehouse Database can support.
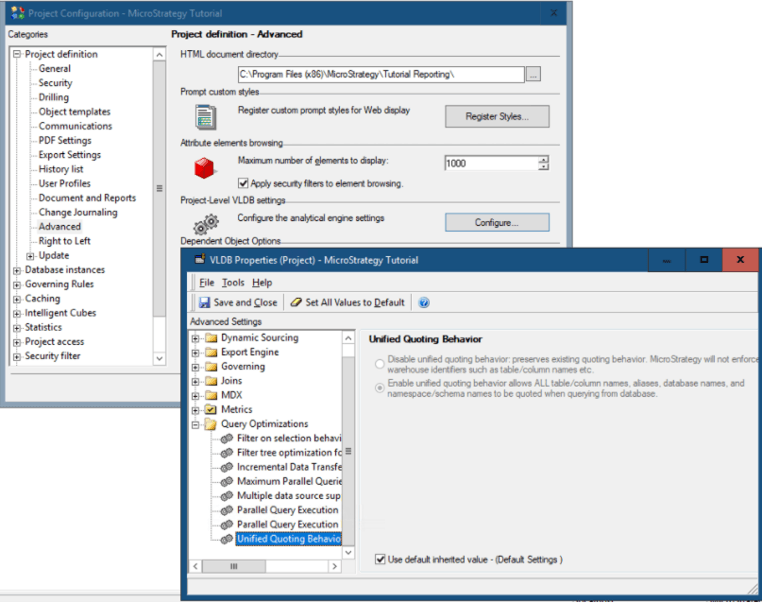
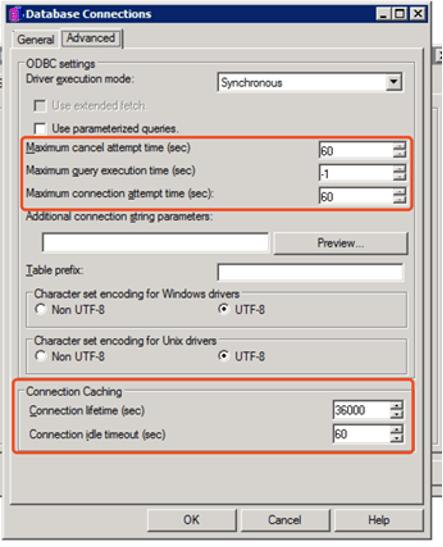
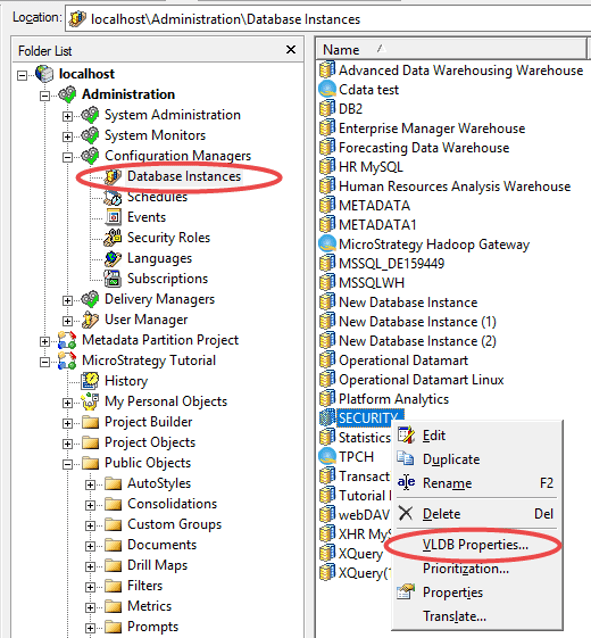
The administrator could also manage database connection threads in some given fields. The settings which are used to control database connection are located on database instance level. See the below screenshot:
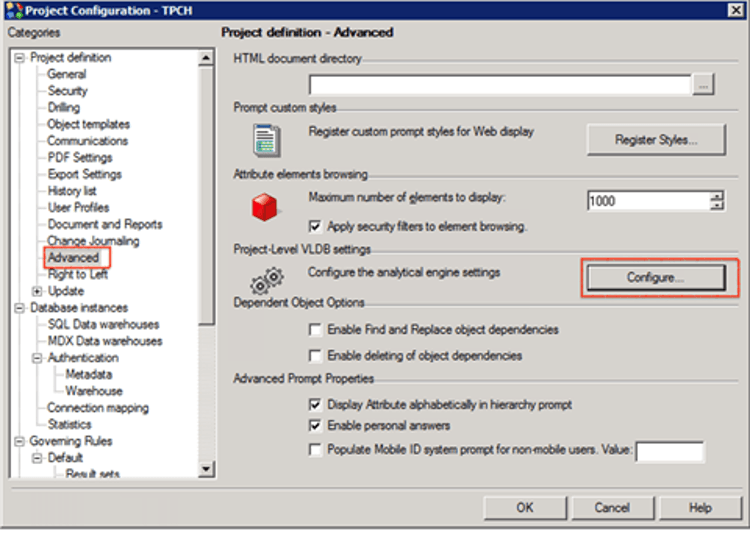
Project level: Right-click on the project name > Project Configuration > Advanced > Configure.
Database instance level: Database Instance > VLDB Properties
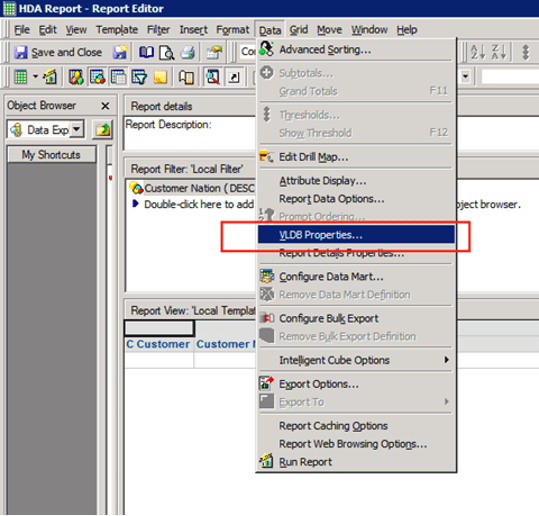
Report level: Data > VLDB Properties
Unhide parallel options: Tool > Show Advanced Settings