Starting with the release of Strategy ONE (March 2024), dossiers are also known as dashboards.
For more detailed information on setting up and customizing this visualization, please refer to the tutorial Creating bullet charts with threshold markers in documents and dossiers
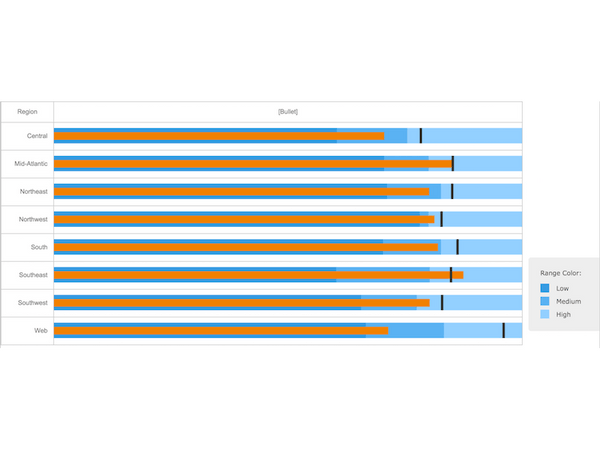
The Bullet Chart has five main components:
Object requirements:
Minimum Strategy version: 10.2
Publisher: Strategy
To install this visualization:
Note: The sample "BulletChartDemo.mstr" only works with Strategy versions 10.11 and above.
By downloading or using this visualization, you accept and acknowledge these terms.
This visualization is both intended as sample code and provided as a convenience to Strategy users. Strategy cannot guarantee that the code provided will apply to any Strategy releases and clients outside of the versions stated within this article. This sample is supported by Strategy Technical Support up to and including the basic visualization functionality listed in this article. Defects will be triaged by the Strategy team as they are raised. For users with active Strategy Technical Support contracts, contact Strategy Technical Support to raise these defects.
Anyone seeking to use this visualization is encouraged to review and adapt this sample based on user requirements. Contact Strategy Professional Services for assistance with these same adaptations. If users would like to provide feedback on or recommendations for this visualization, post in the comments section of this article.
Interested in learning more about Dossier authoring? Visit the Learning Center on Community!
Or feel free to go to our Documentation pages for more product information.