EducationSoftwareStrategy.com
StrategyCommunity

Knowledge Base

Product

Community

Knowledge Base

TopicsBrowse ArticlesDeveloper Zone

Product

Download SoftwareProduct DocumentationSecurity Hub

Education

Tutorial VideosSolution GalleryEducation courses

Community

GuidelinesGrandmastersEvents
x_social-icon_white.svglinkedin_social-icon_white.svg
Strategy logoCommunity

© Strategy Inc. All Rights Reserved.

LegalTerms of UsePrivacy Policy
  1. Home
  2. Topics

Connecting the Safari Web Inspector to a HTML5 Visualization within MicroStrategy Mobile 10.x for iOS


Tiago Siebler

Principal Product Specialist • Strategy


Debugging issues with a D3/HTML5 visualization may be a simple task when reproducible in MicroStrategy Web. This tutorial demonstrates how to debug and extract more information when a D3/HTML5 visualization fails to render in MicroStrategy Mobile, by connecting Web Inspector / Developer tools, included with Safari.

Prerequisites:

  • Refer to the Installation and requirements article in the Strategy Mobile SDK developer zone for detailed prerequisites on using Strategy Mobile in Xcode.
  • This tutorial assumes familiarity with Developer Tools / Web Inspector, used for debugging and testing with HTML, CSS & Javascript based scenarios.
  • It will therefore only cover the process of connecting the Safari Web Inspector to a HTML5 Visualization in Strategy Mobile.
  • Note: Users do not need to be enrolled in the iOS Developer Program for testing with the iOS Simulator. That requirement is only for app distribution.

Getting Started


This tutorial assumes that Strategy Mobile has been deployed and is running in the iOS Simulator, included with Xcode. Once Strategy Mobile has been deployed in the iOS Simulator it can be configured to connect to a Strategy Mobile server (reachable from the same network), similar to the out of the box Strategy Mobile application from the App Store.
For detailed guidance, refer to the Testing MicroStrategy Mobile 10.x in the iOS Simulator tutorial. Once the app is running in the iOS Simulator and configured, navigate to the Visual Insight Dashboard or the Report Services Document where the HTML5 Visualization is not functioning as expected.
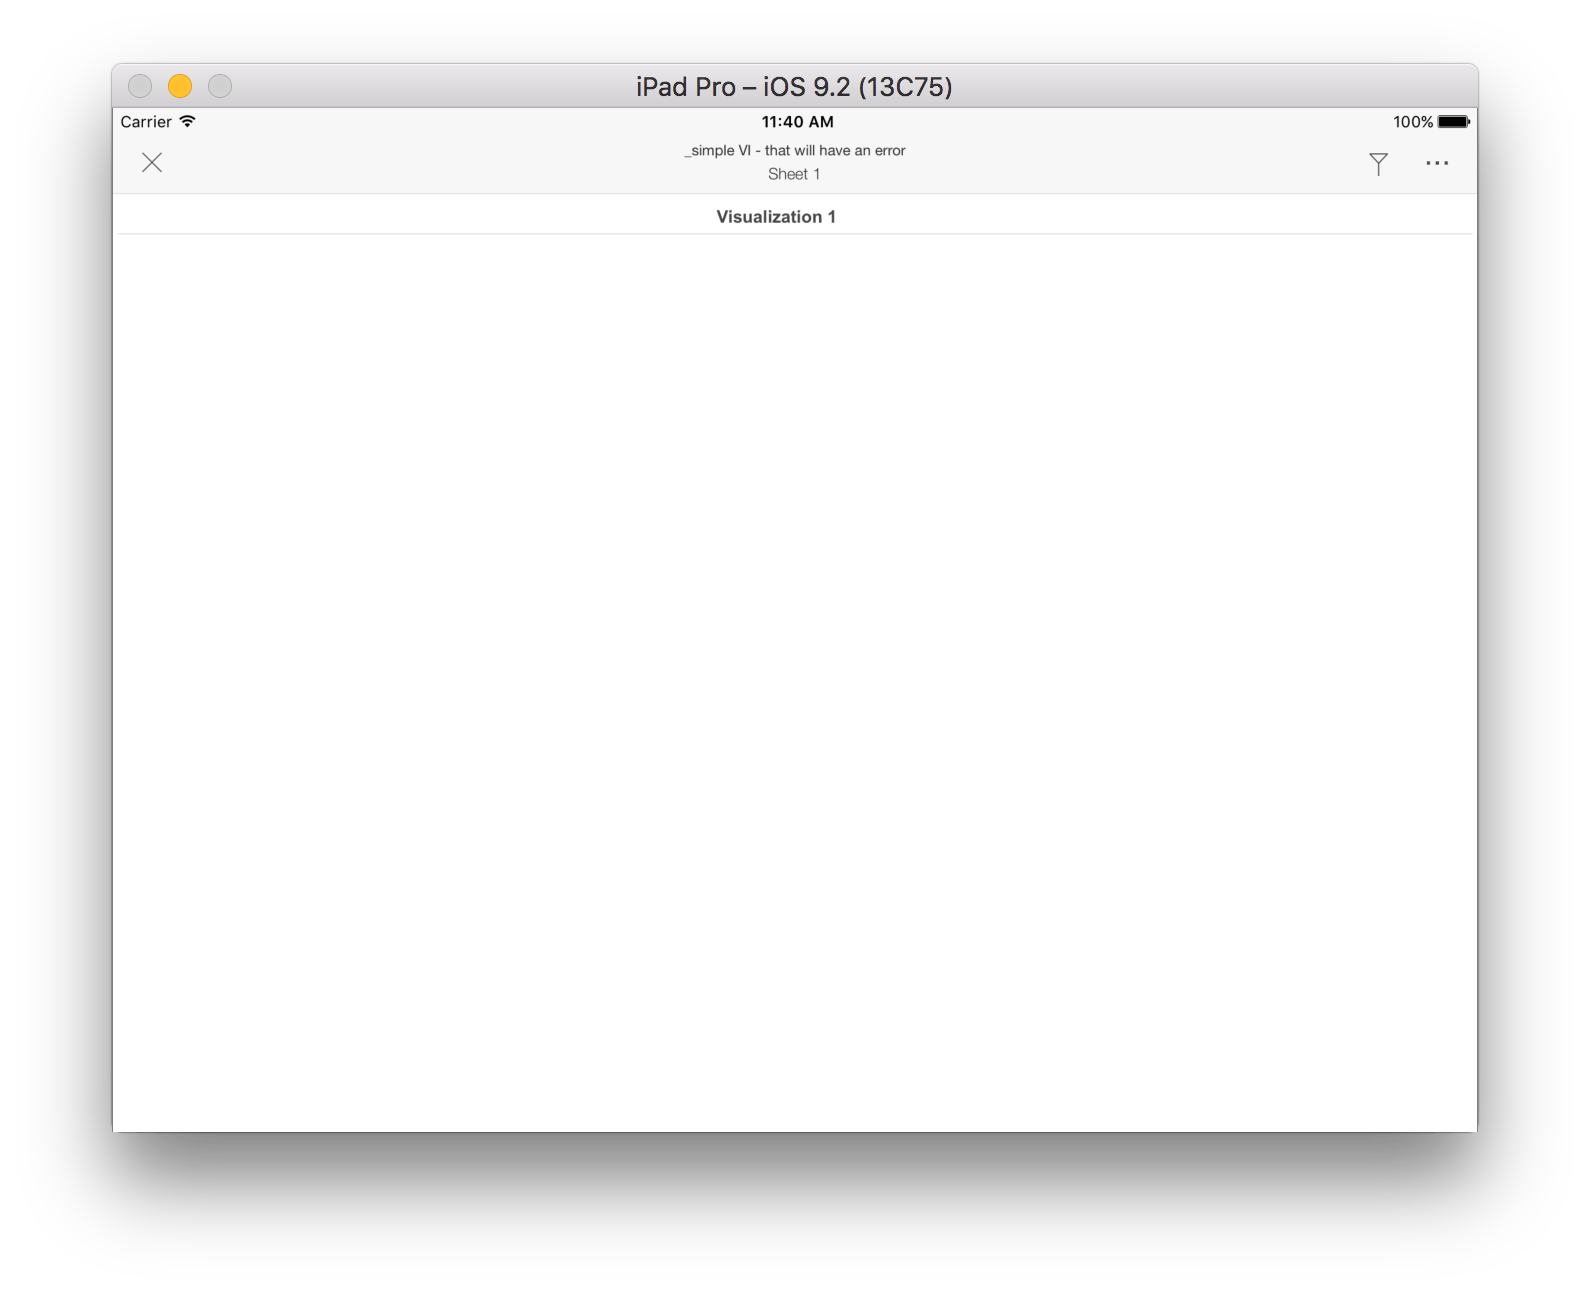
At this stage, before continuing, the issue is reproduced and visible within the iOS Simulator:

ka04W000001Ivl0QAC_0EM440000002Ojn.png

Enabling Developer Tools within Safari

  • On the same Mac, open the web browser, Safari:
ka04W000001Ivl0QAC_0EM440000002Ojs.png
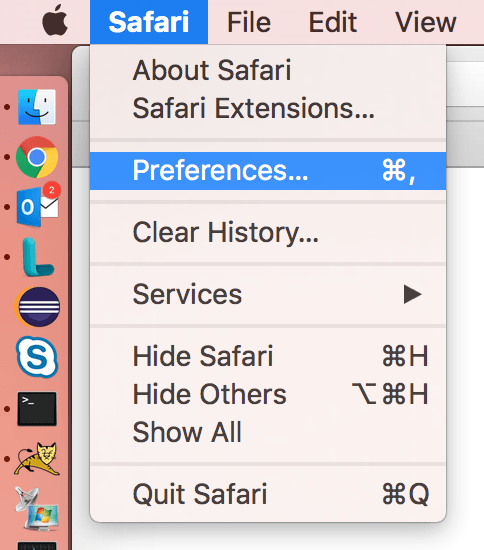
  • Within Safari, select Safari from the menubar and open preferences:
ka04W000001Ivl0QAC_0EM440000002Ok2.png
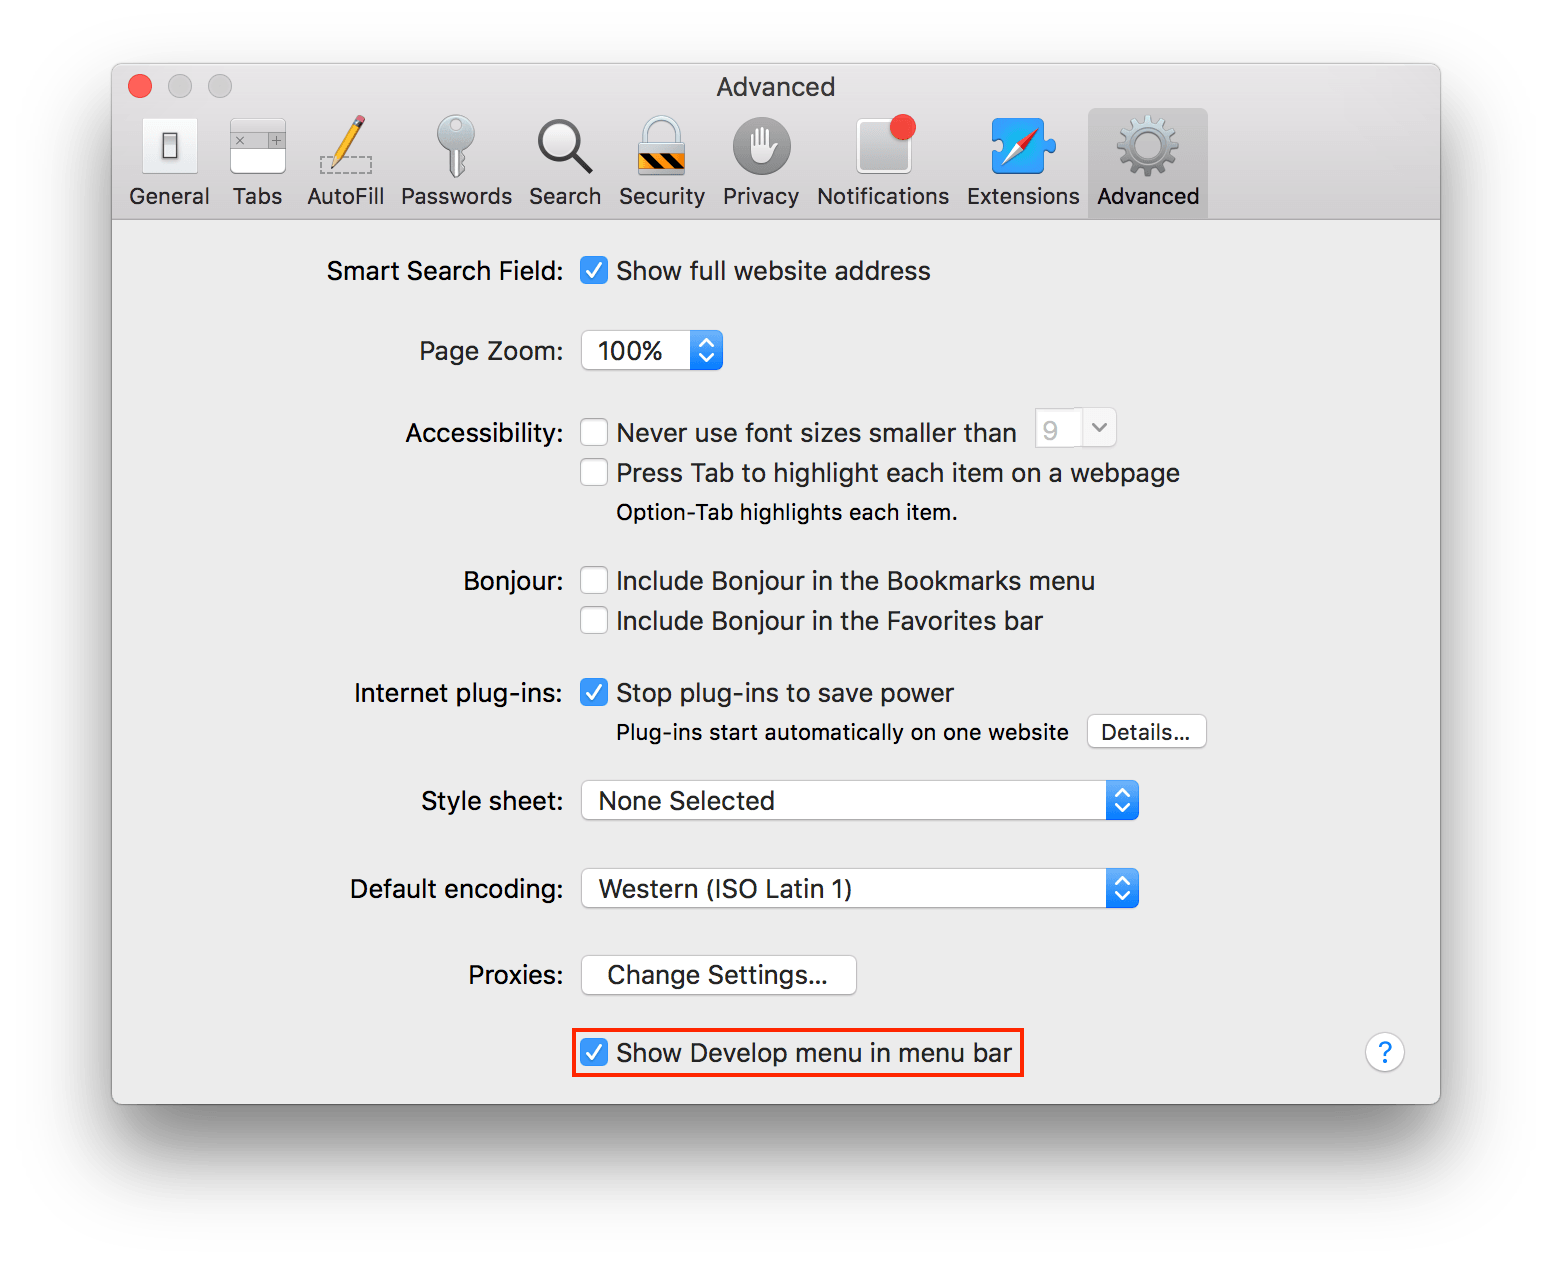
  • Select Advanced from the toolbar at the top, and ensure "Show Develop menu in the menu bar" is selected:
ka04W000001Ivl0QAC_0EM440000002Ok7.png
  • The Develop option is not enabled by default. This ensures that you have access to the Develop menu within Safari, which is needed to continue from here.

Connecting Web Inspector to Strategy Mobile

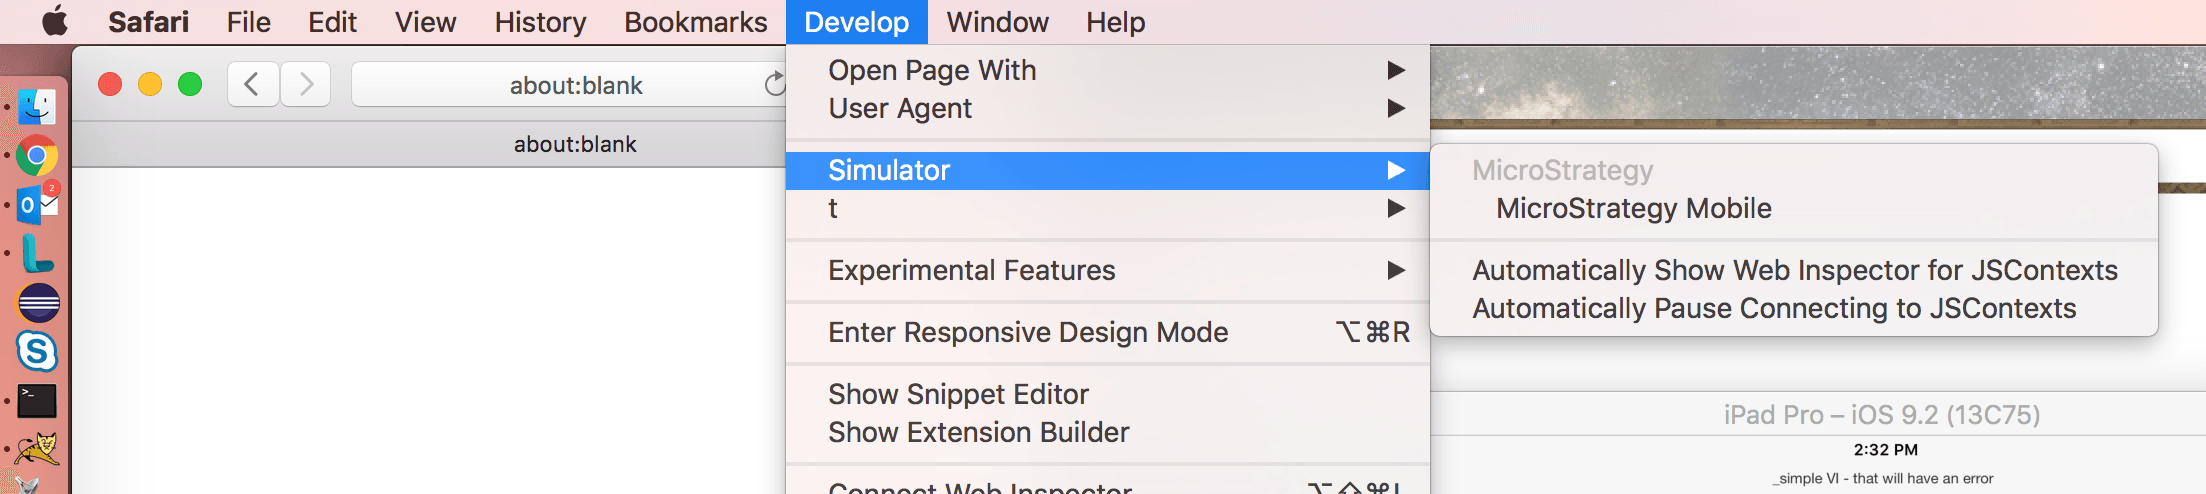
  • Now that the Develop menu has been enabled, select it from the menubar - there will now be an option labelled "Simulator", visible while the iOS simulator is running on the same machine:
ka04W000001Ivl0QAC_0EM440000002OkH.png
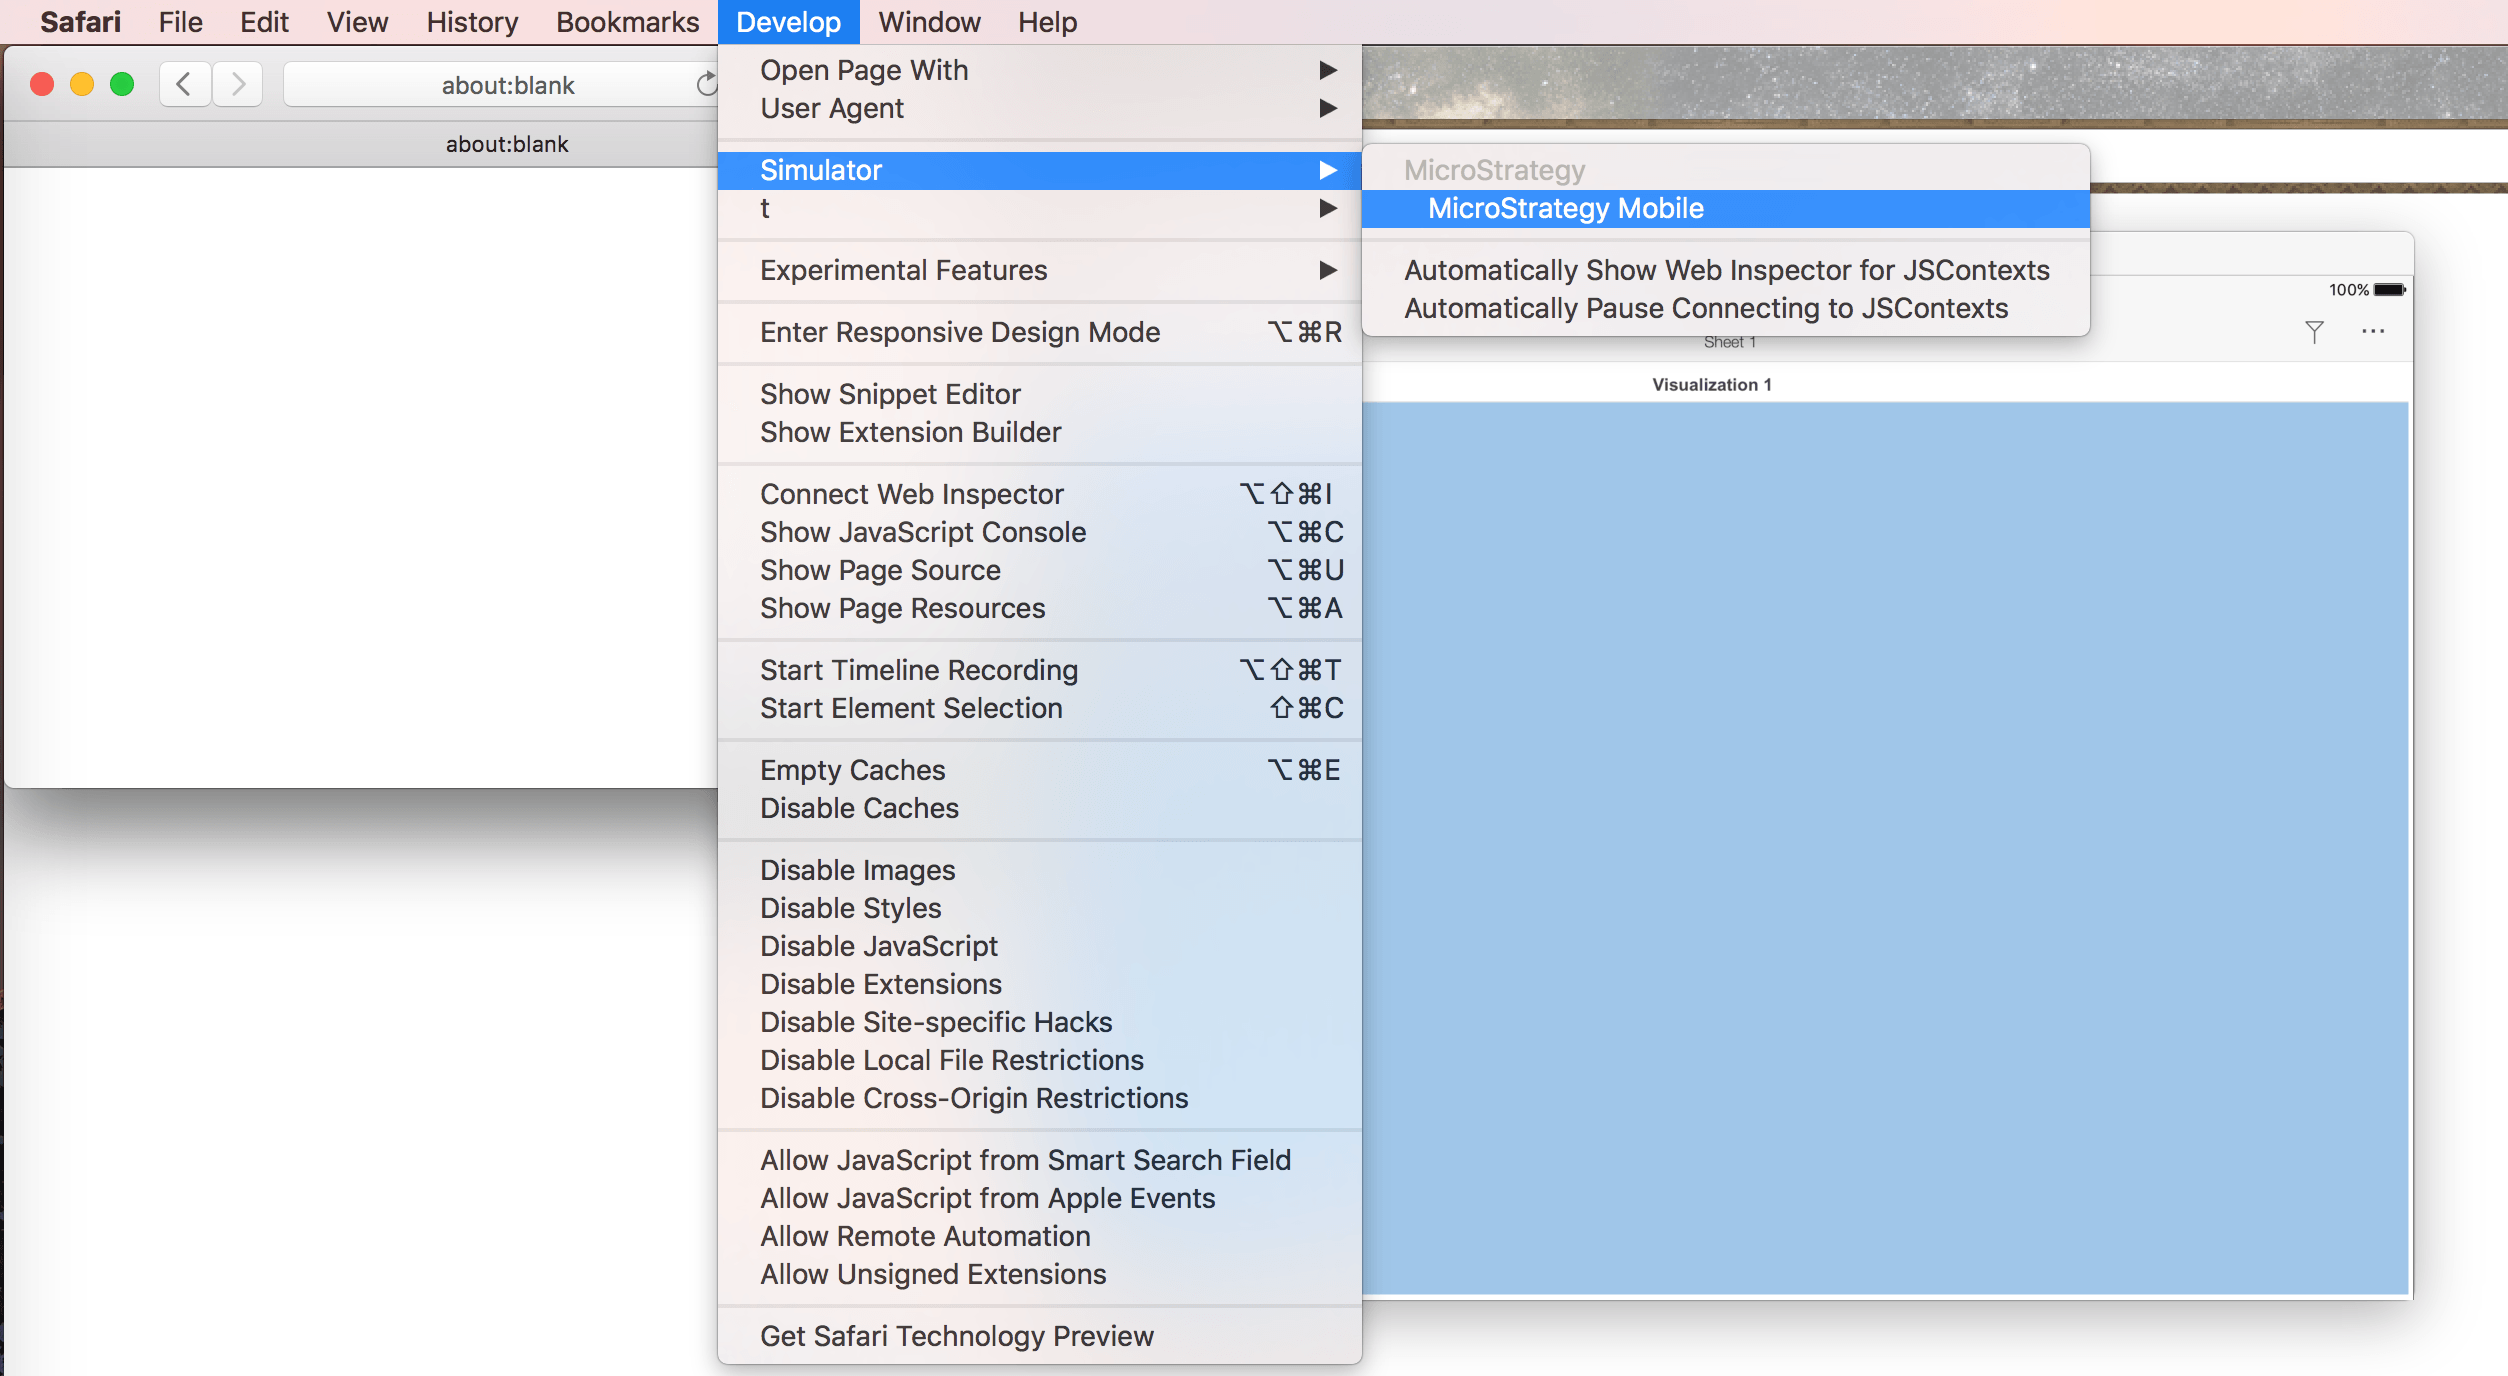
  • Under Develop -> Simulator, in Safari, Strategy Mobile will be shown if a Javascript view (such as a HTML5 Visualization) is detected within Strategy Mobile running in the simulator:
ka04W000001Ivl0QAC_0EM440000002OkM.png
  • While hovering over the items listed under Develop -> Simulator, the corresponding section within Strategy Mobile (within the iOS Simulator) will be highlighted in blue. This can be seen in the screenshot above.
  • Click on the view that represents the visualization within Strategy Mobile. This will open Developer Tools / Web Inspector, connected to the visualization within Strategy Mobile, within the iOS Simulator:
ka04W000001Ivl0QAC_0EM440000002OkR.png
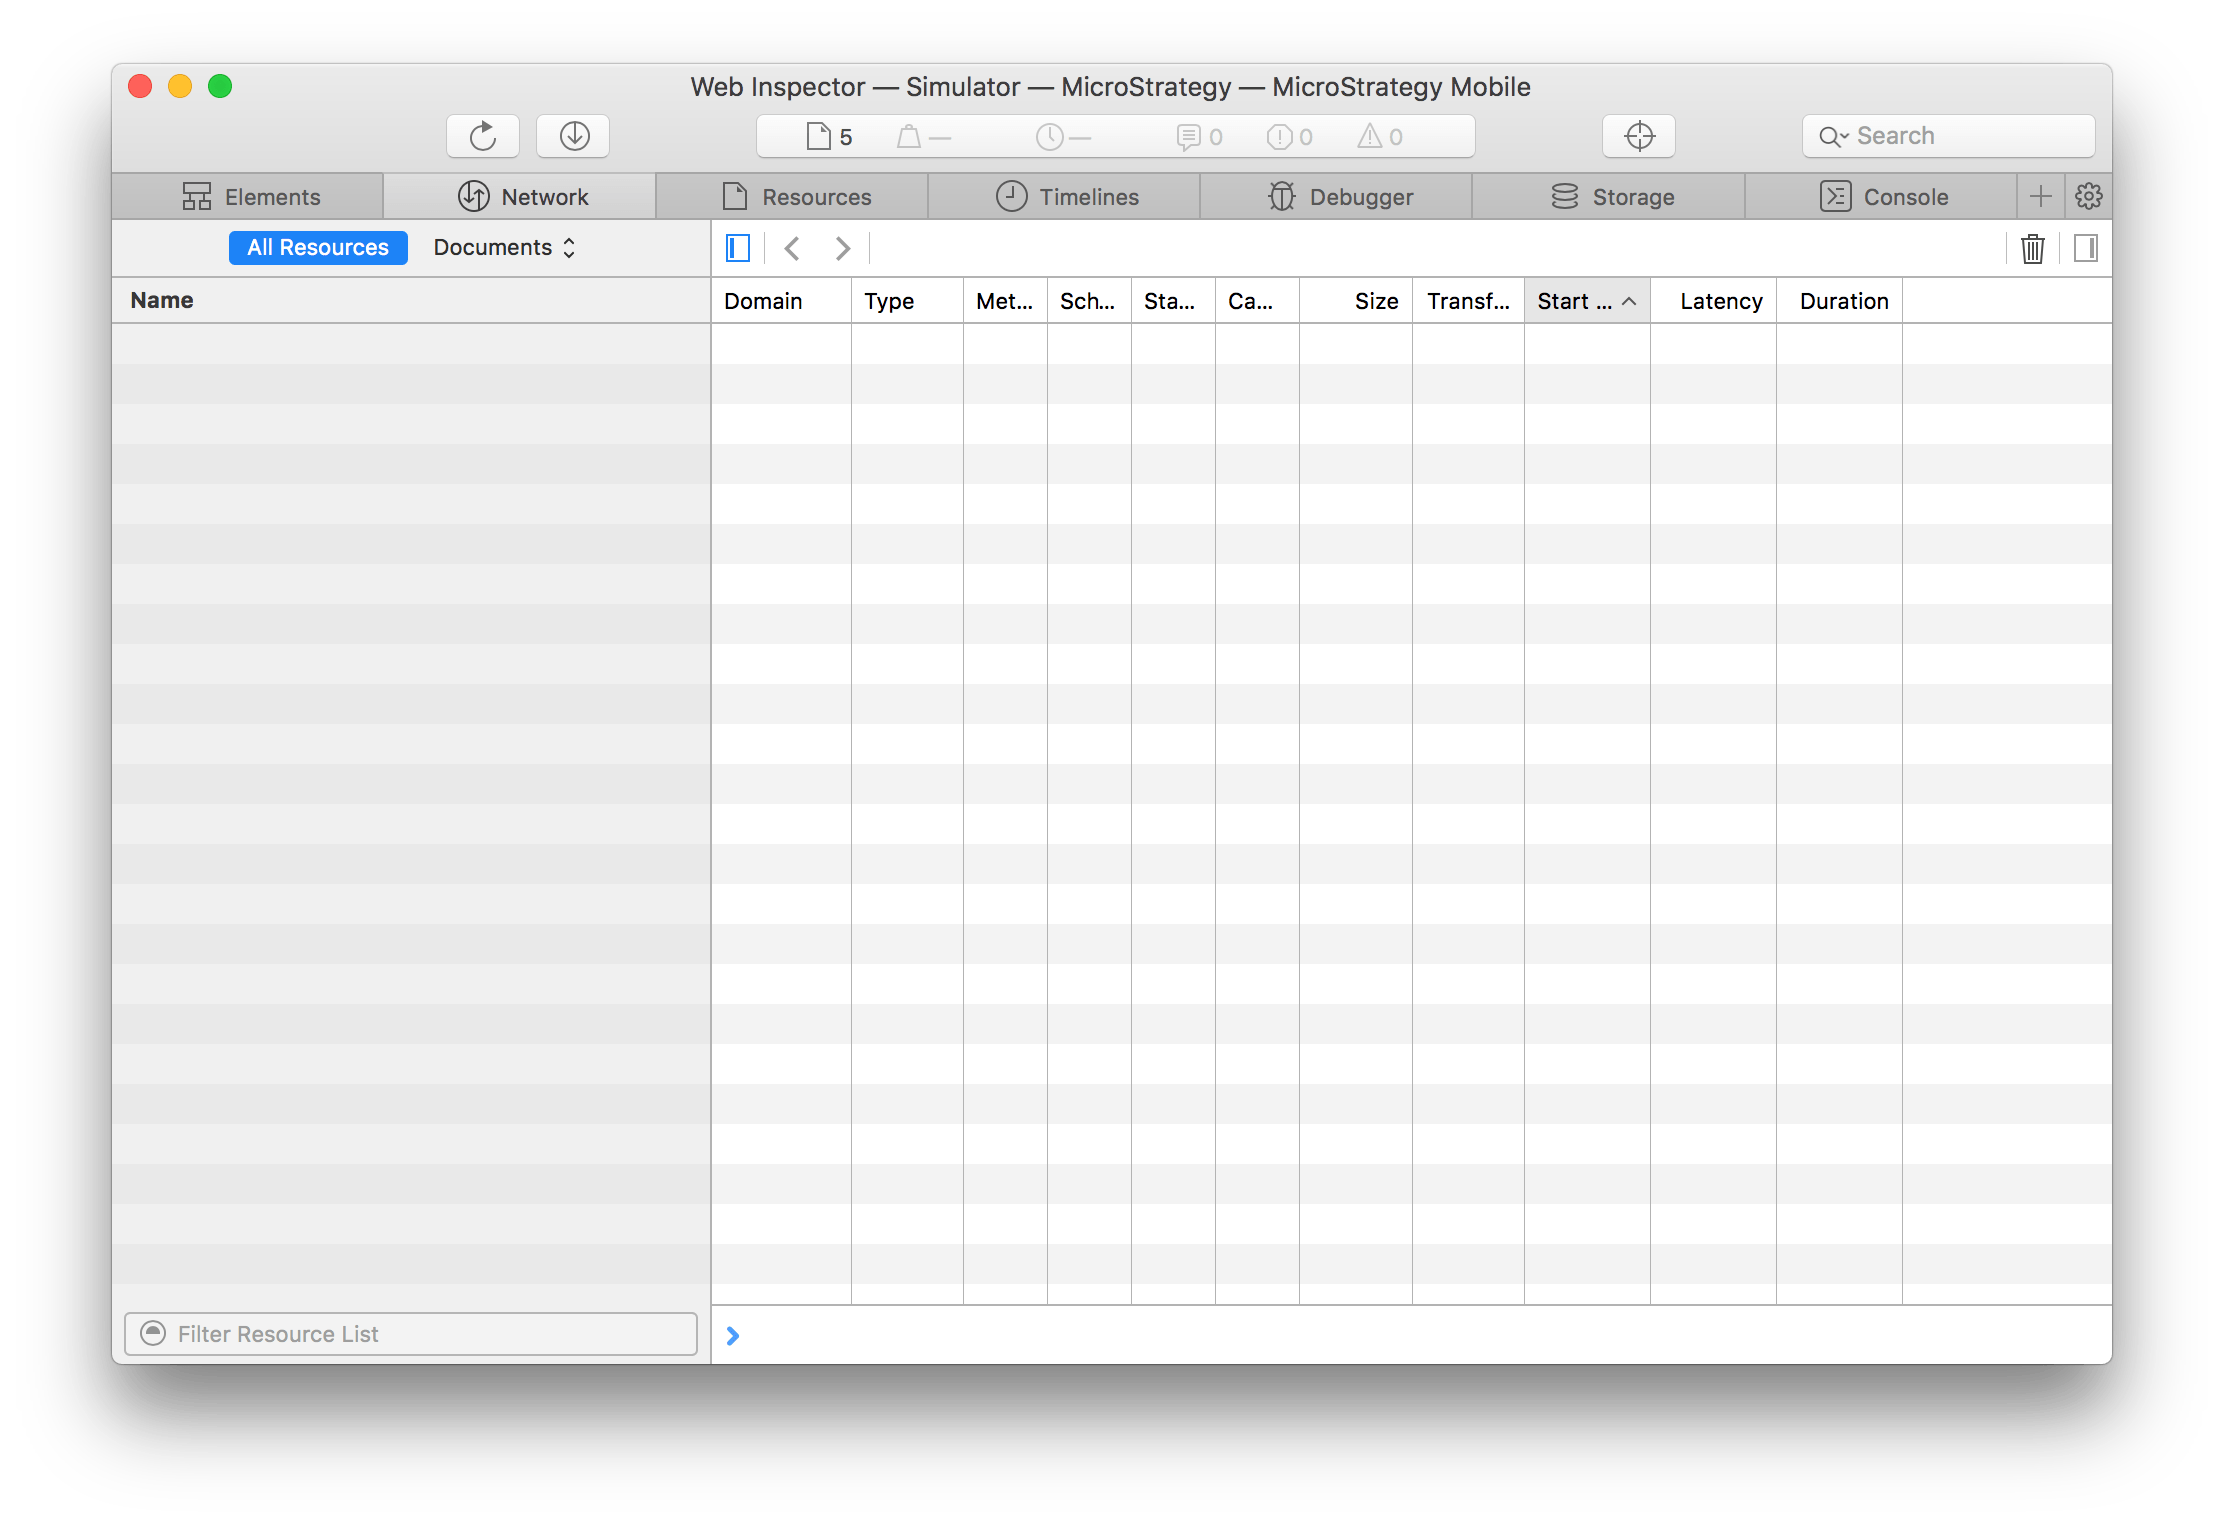
  • At this stage it will only display what happens after the Web Inspector (Developer Tools) was connected. To view what happened while the visualization attempted to load, click the refresh button in the left part of the menubar:
ka04W000001Ivl0QAC_0EM440000002Okb.png
  • This will trigger the HTML5 Visualization to reload, populating the Web Inspector with any information from the load process. 
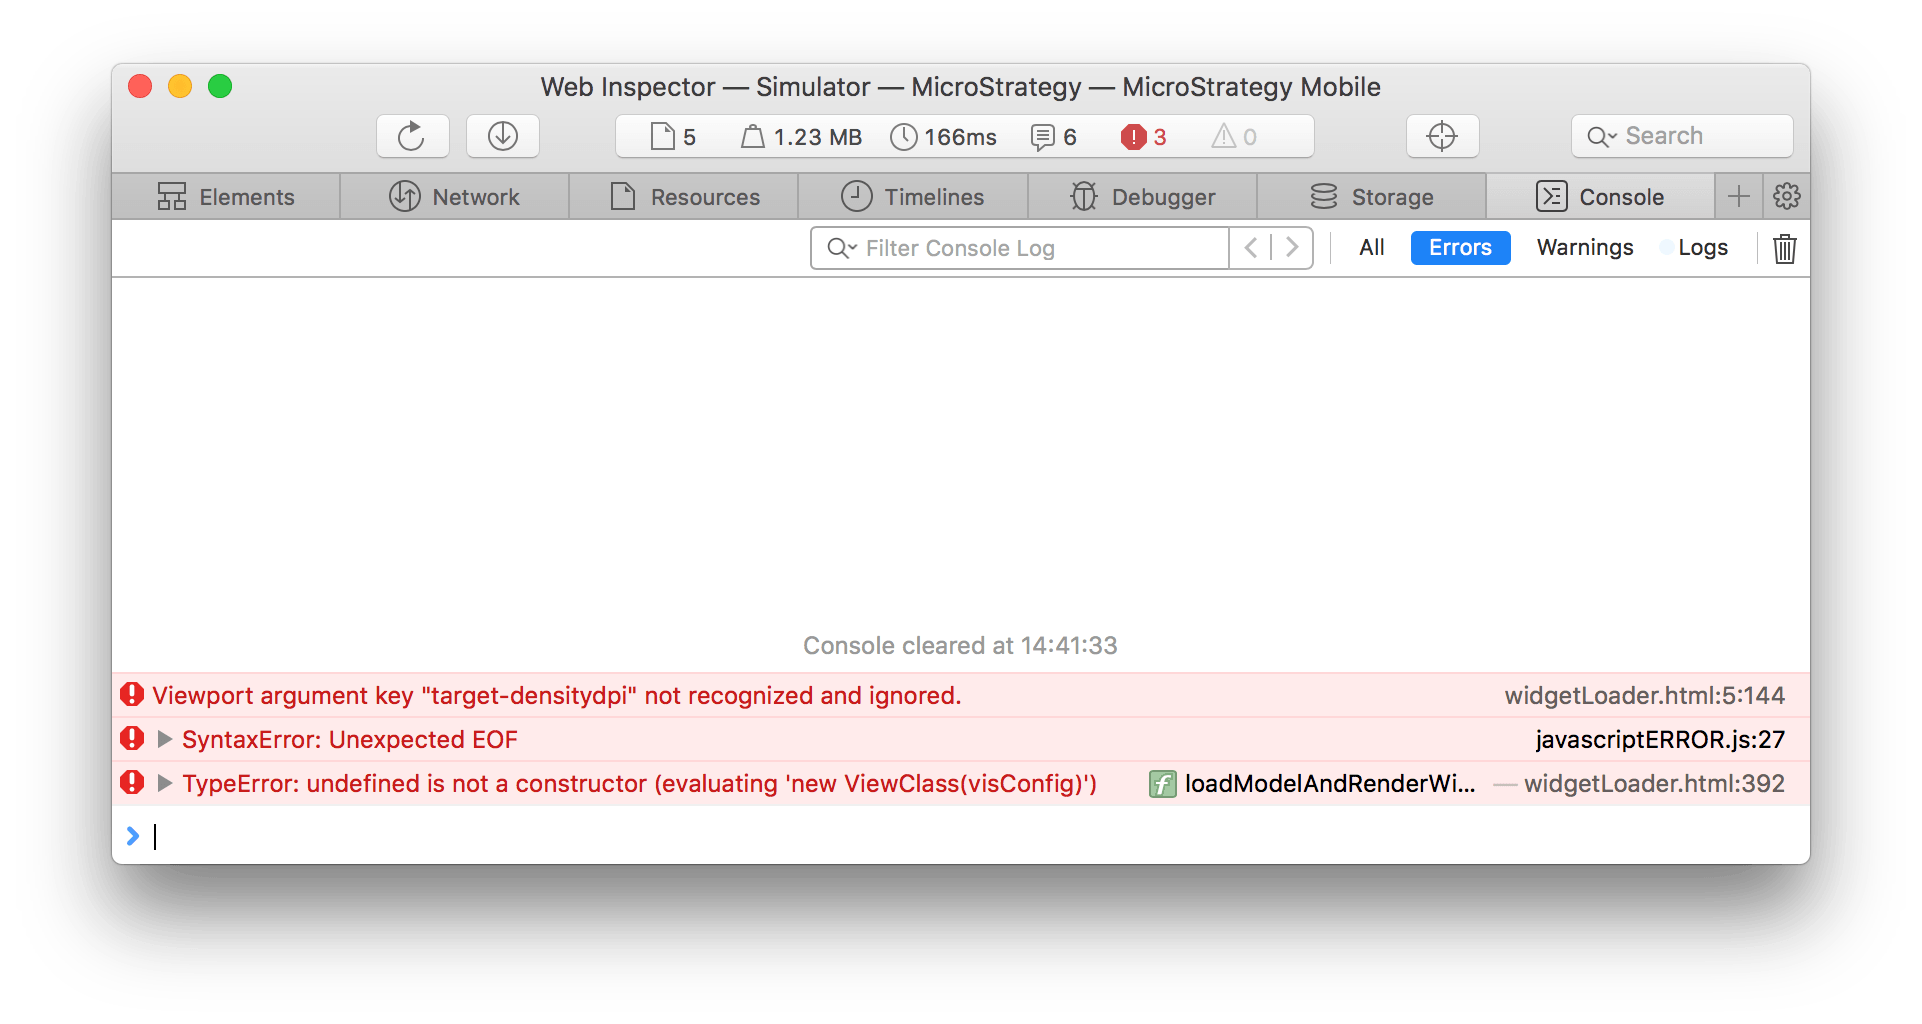
  • The JavaScript console within the Web Inspector will now display any debugging information and errors that occurred during this process, providing valuable context to what may have prevented the visualization from rendering as expected:
ka04W000001Ivl0QAC_0EM440000002Okg.png

The Web Inspector within Safari can now be used to further debug the visualization while being rendered in Strategy Mobile.


Comment

0 comments

Details

Knowledge Article

Published:

June 8, 2017

Last Updated:

June 8, 2017