Starting with the release of Strategy ONE (March 2024), dossiers are also known as dashboards.
I have created a Python script that gathers information about all the objects within Strategy Project, checks direct relations and iterates through them to compile a table of extended relations. As a result a few CSV files are generated and those can be used in a dossier to visualize direct and extended relations between objects.
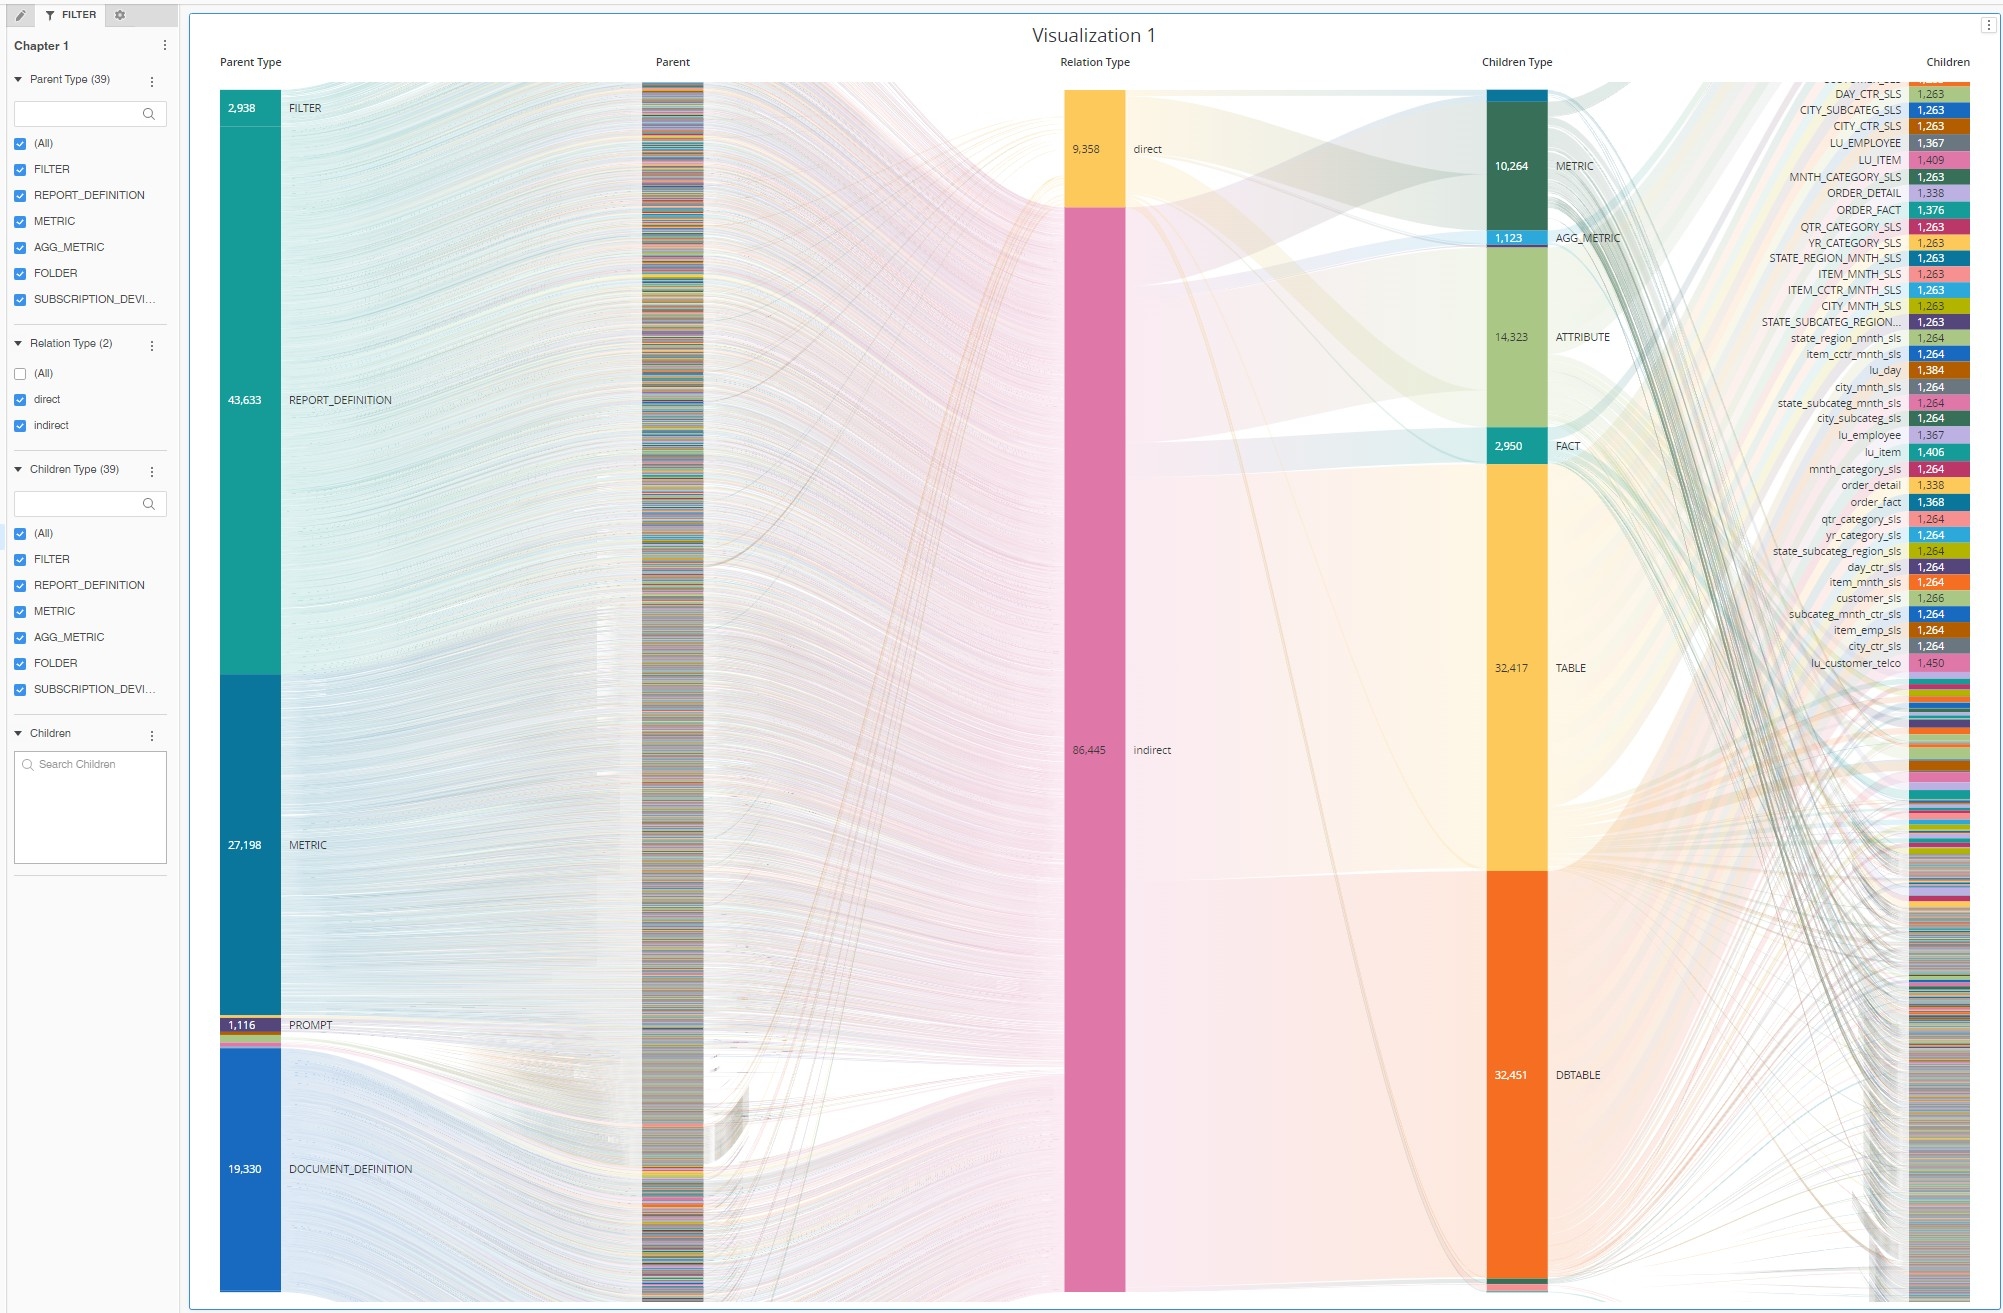
Putting all the objects and relations on a Sankey Diagram renders rather an illegible chart.
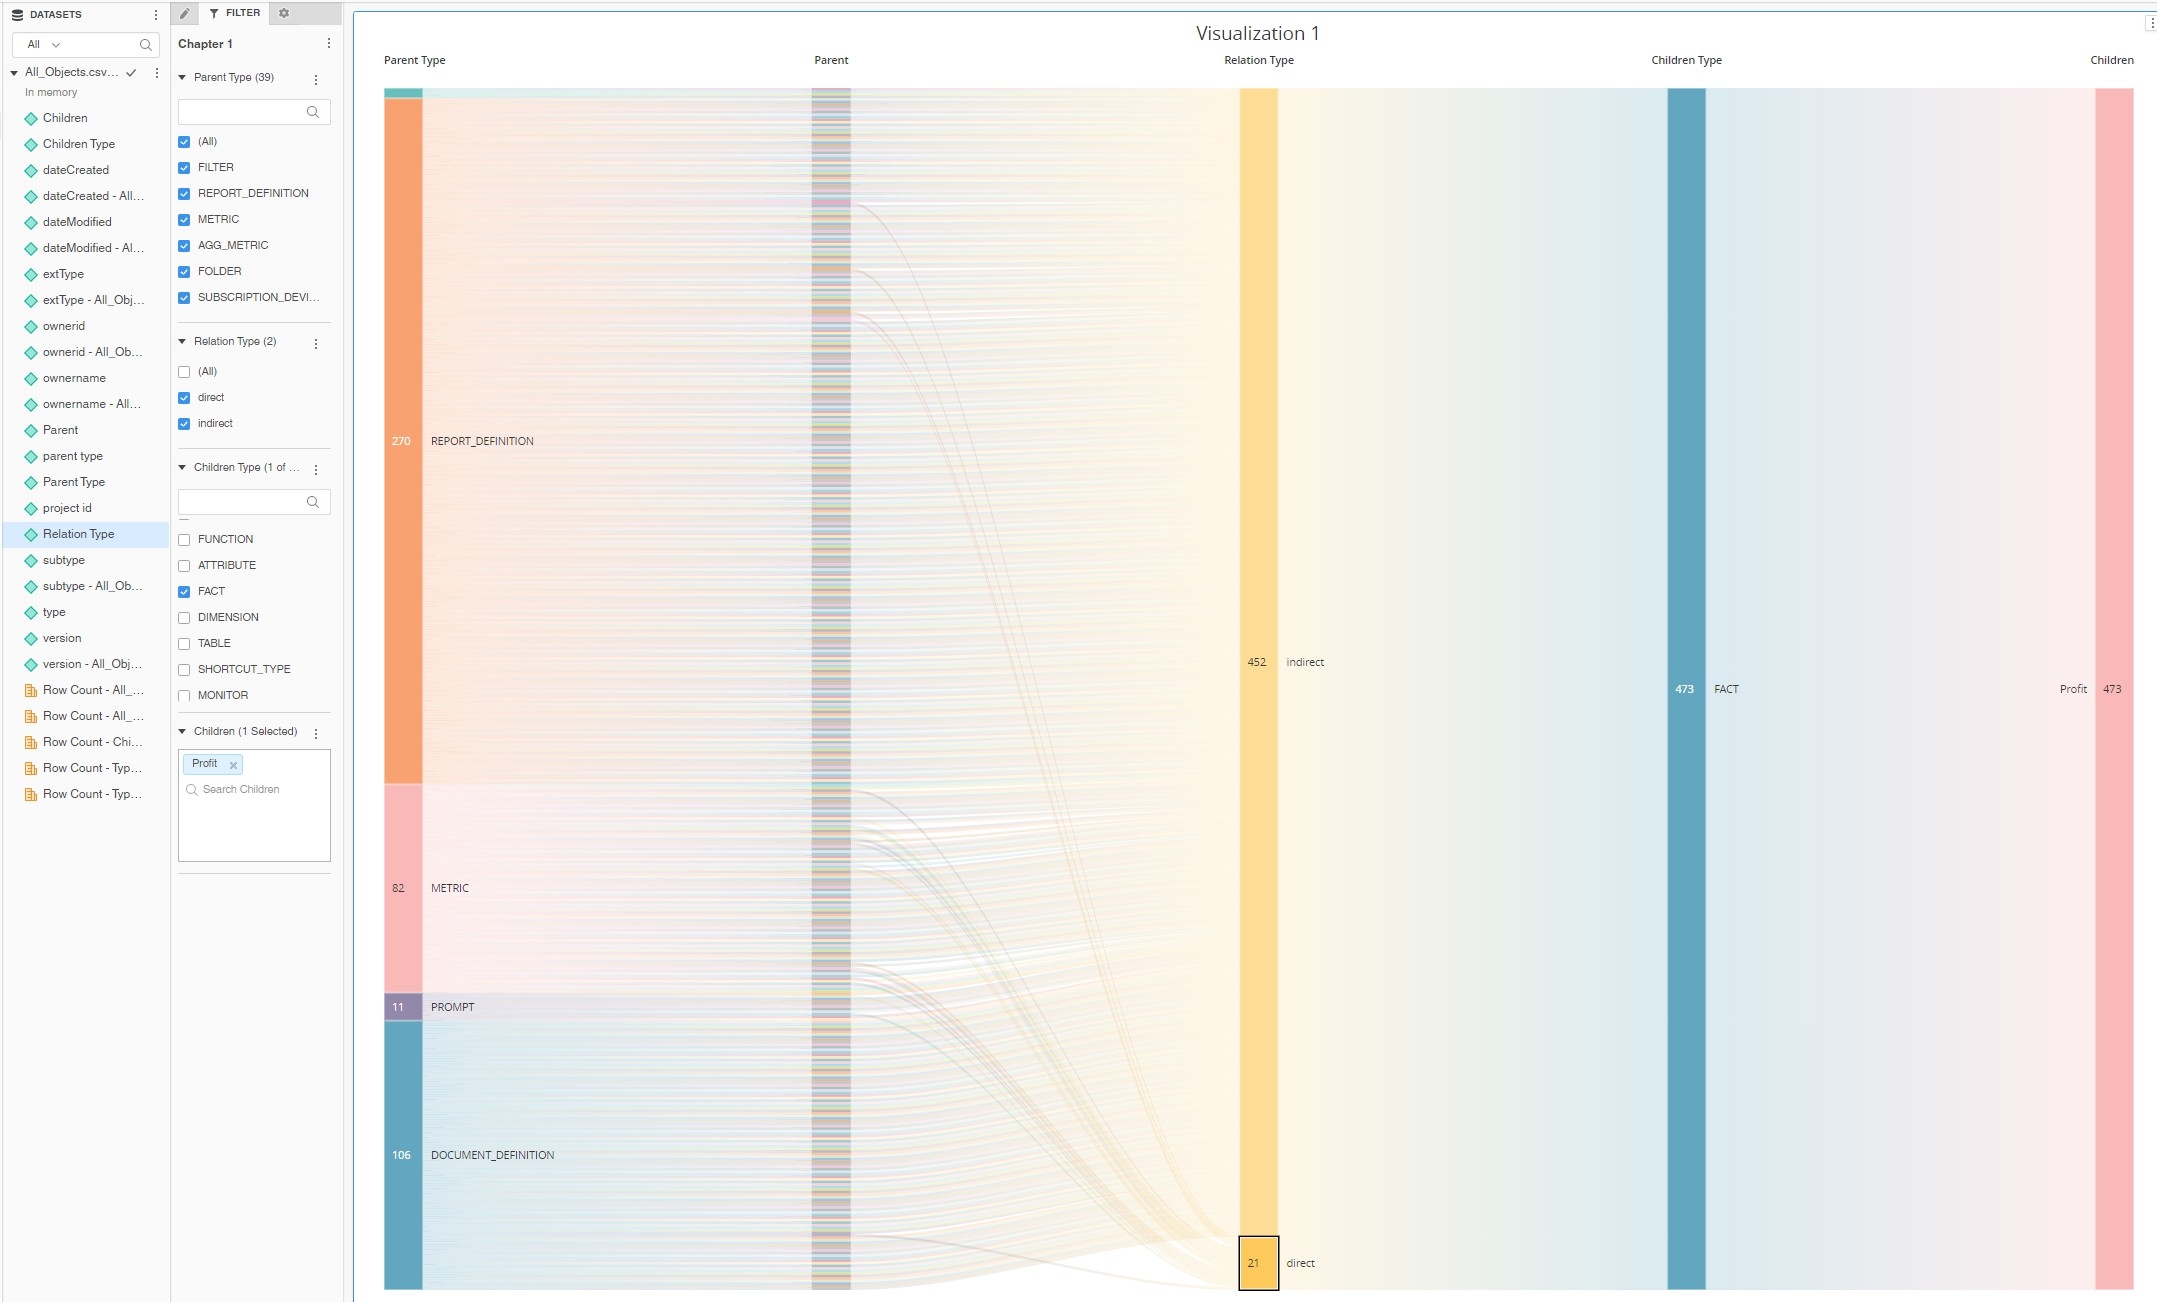
In the example below I am filtering on the children branch by selecting only "Profit" fact.
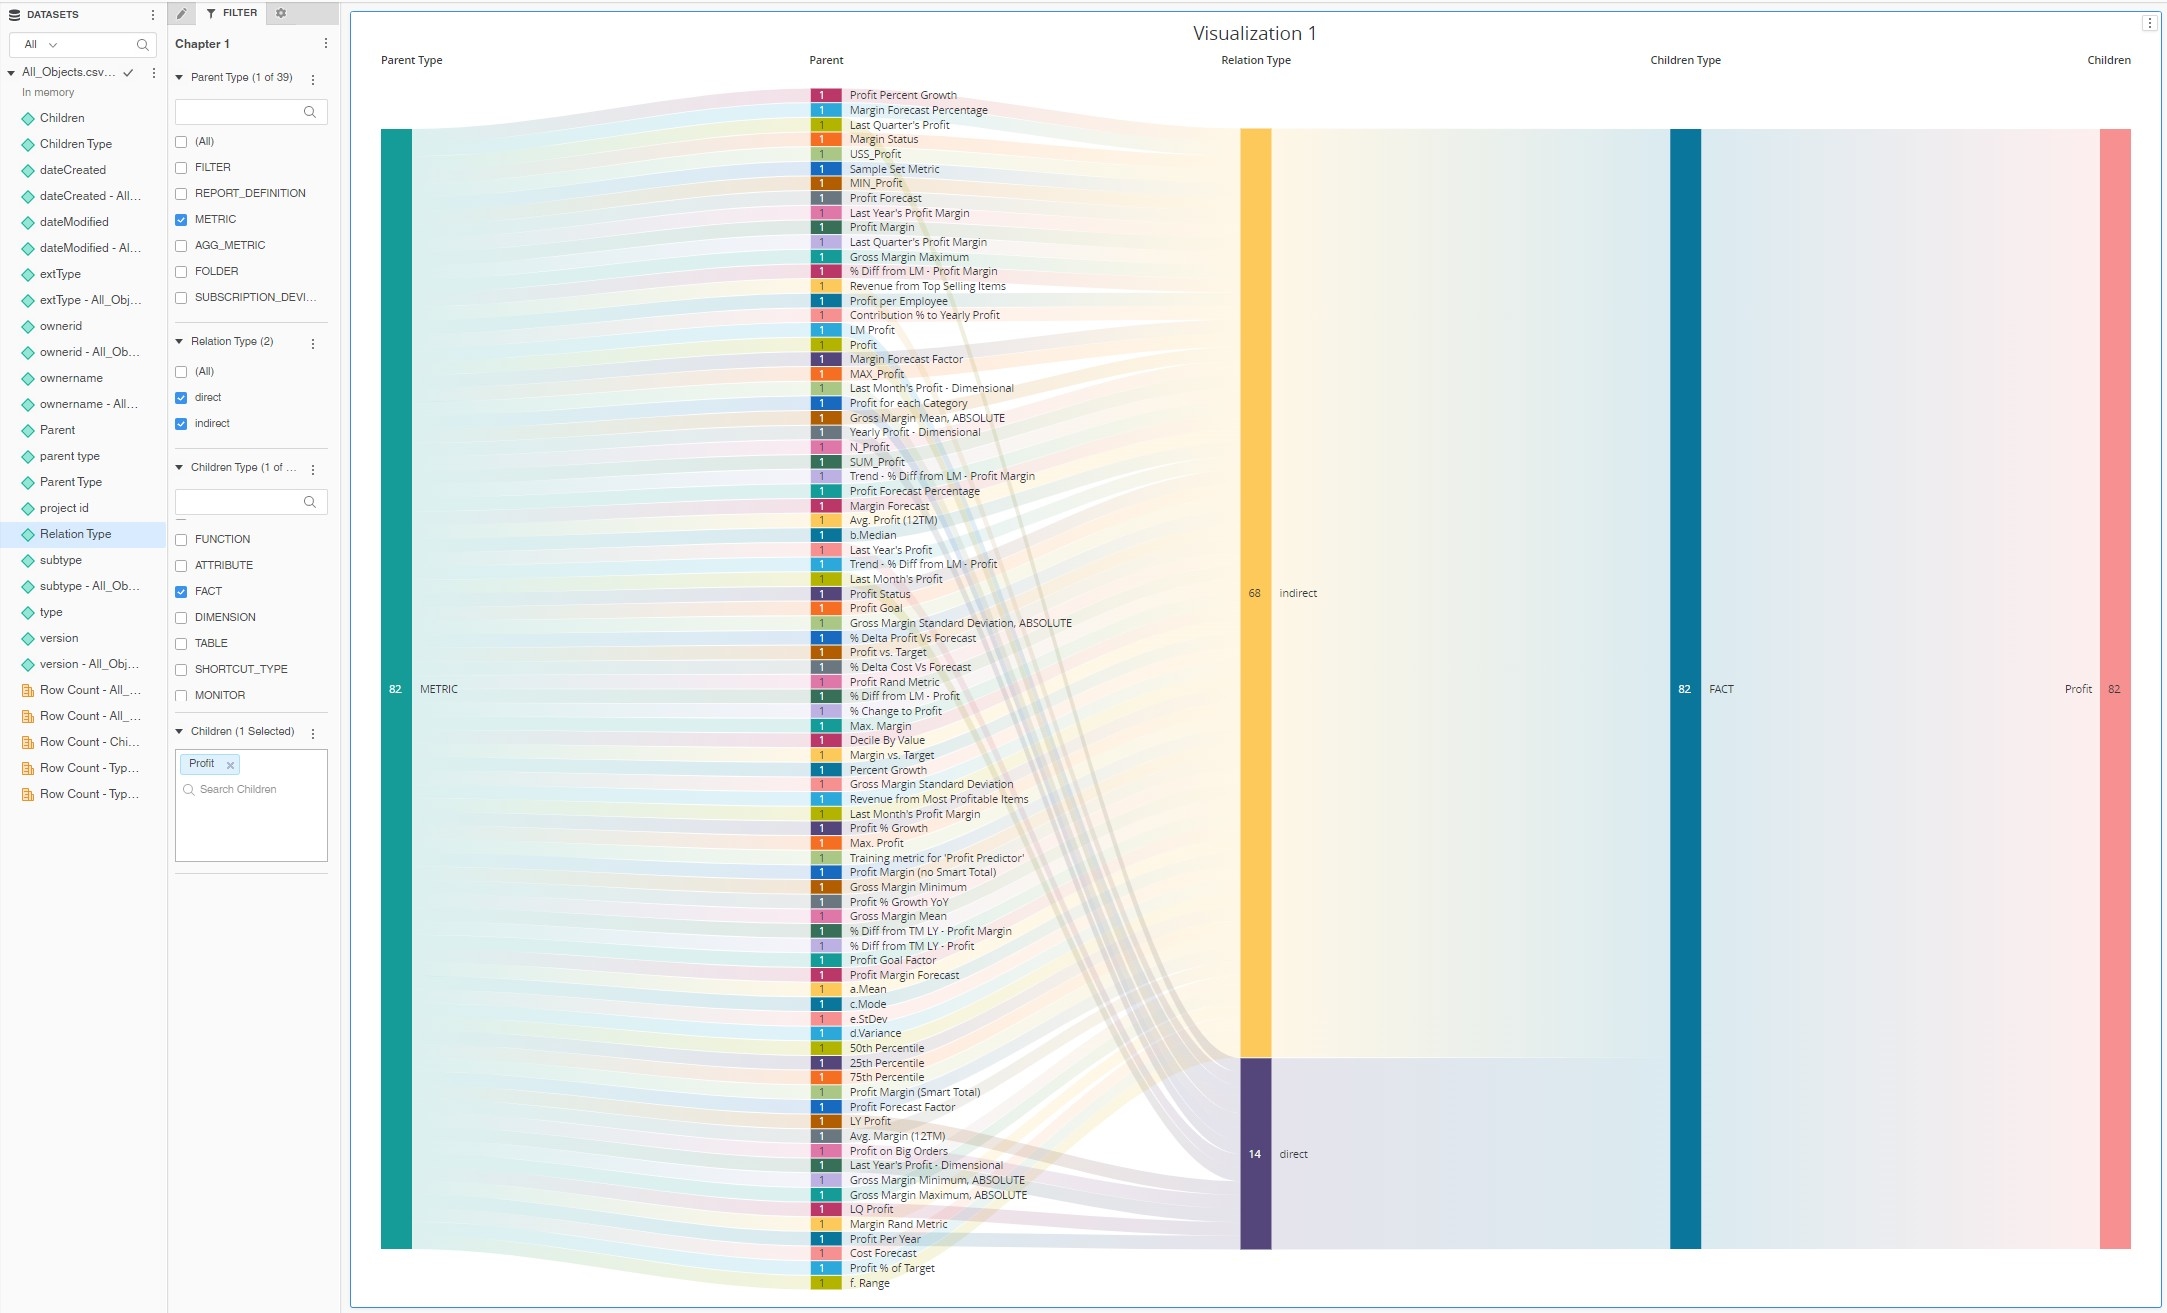
Setting up one more filter ParentType="Metric" further helps with understanding the chart. We can clearly see that there are around 15 metrics that are built directly with Fact "Profit" in their formula. There are many more metrics that have indirect relations with this fact for example by using other metrics in their formula (LM Profit metric > Profit metric > Profit fact).
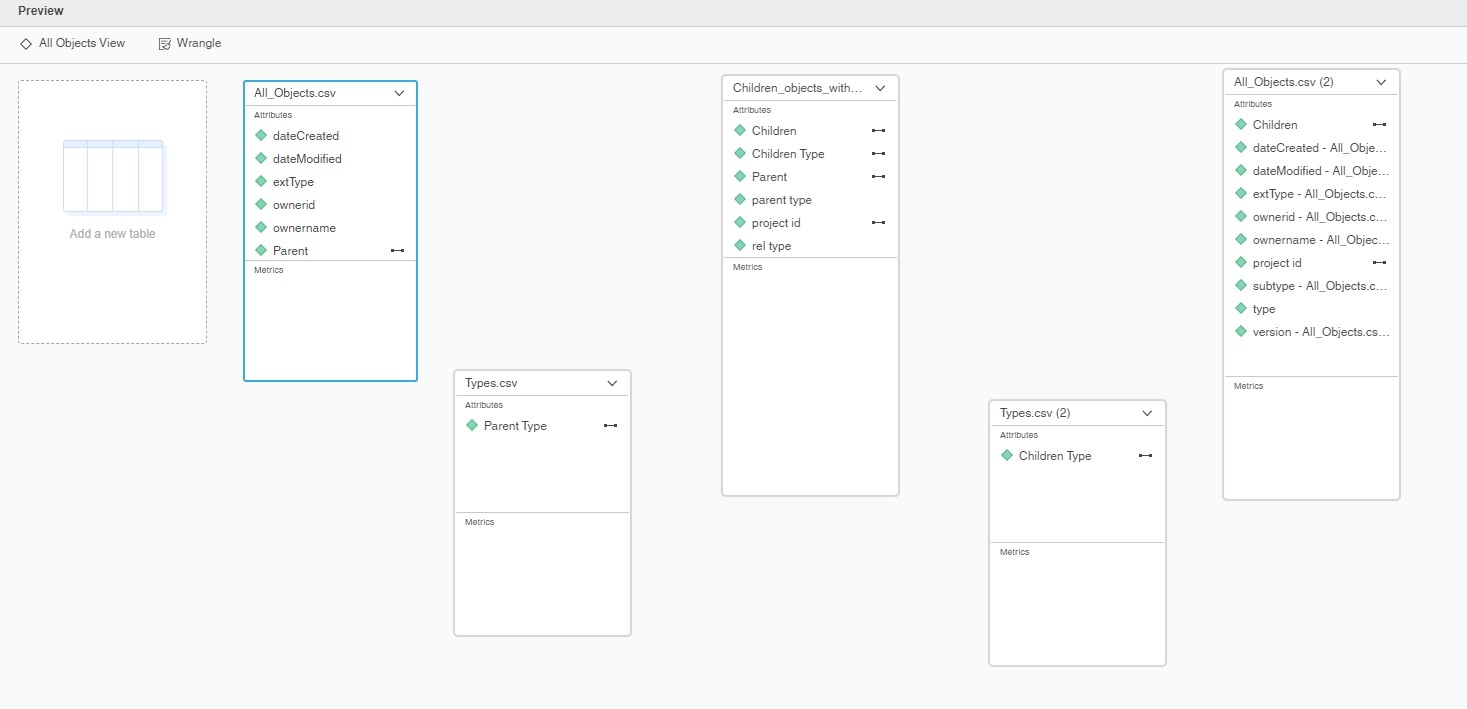
I have created this dossier by combining CSV files generated by my Python script. Some tables have been imported twice to provide data both for Parent and Children attributes.
I'm attaching to this post Jupyter Lab file containing Python script, CSV files generated by the script for Strategy Tutorial Project, mstr file with visualization of Tutorial Project objects relations.
I also wrote another example of a Python script that collects data for a different representations of relations. It collects data that allow building a deeper hierarchy. It might be more familiar to users analyzing Strategy objects lineage: Document > Dataset > Report Object > Schema Object > Table
Please note - I've added color formatting in the code below (http://hilite.me/). Code copied from here might not work due to indentation issues. In that case, use attached file with sample code. Also this CRM is adding ';' after URLs.
import csv, json, pickle, itertools
import pandas as pd
import getpass
from mstrio.connection import Connection
from mstrio.server import Environment, Project
from mstrio.object_management import quick_search, full_search
from mstrio.types import ObjectSubTypes, ObjectTypes
from mstrio.project_objects.datasets.super_cube import SuperCube
import datetime;

from mstrio import config
config.verbose = False

mstr_username = "mstr"
mstr_password = getpass.getpass(prompt='Password ')
mstr_base_url = "https://env-319699.customer.cloud.Strategy.com"
mstr_url_api  = mstr_base_url+"/StrategyLibrary/api"

# upload to cube
upload_proj_id   = "B7CA92F04B9FAE8D941C3E9B7E0CD754"
upload_folder_id = "FF2BE32E294E4A2E659C88AC6BA3F918"

# Output format
cube_export = False # make it False if you don't need push data to cubes
csv_export  = True # ..
KEY_SF      = "standalone" #keyword for objects without parent like a metric that is never used in any report
pickle_file = "cube_dict2.pkl"


# Connection
conn=Connection(mstr_url_api, mstr_username, mstr_password, login_mode=1)
env = Environment(connection=conn)

project_id='B7CA92F04B9FAE8D941C3E9B7E0CD754'
conn.select_project(project_id=project_id)


# ## Functions


def export_to_csv(level_id, df):
    df.to_csv(f"{level_id}.csv", index=False, encoding='utf-8', sep=",", quoting=csv.QUOTE_ALL, escapechar="\\", header=True)

def search_deps_ids(conn, project_id, obj_id, obj_type, types_in_scope): # this one takes an object ID to search
    objects = full_search(
        conn,
        project=project_id,
        used_by_object_id=obj_id,
        used_by_object_type=obj_type
    )
    return [[d["id"],d["type"]] for d in objects if d["type"] in types_in_scope]

def unique_list(alist): # sorts a list of lists
    alist.sort()
    alist=list(alist for alist,_ in itertools.groupby(alist))
    return alist

def find_comps(dep, rel_type, direct_deps): #find components
    deps_list=[]
    for dir_dep in direct_deps:
        if dir_dep[1]==dep[4]:
            new_dep=[dep[0],dep[1],dep[2],rel_type,dir_dep[4],dir_dep[5]]
            deps_list.append(new_dep)
    return deps_list


# #### Get all the objects details


objects = quick_search(conn, project_id, object_types=[t for t in ObjectTypes])

all_objects=[]
for i,t in enumerate(objects[:]):
    all_objects.append([project_id, t['name'],t['id'],t['type'],t['subtype'],t['extType'],t['dateCreated'],
                        t['dateModified'],t['version'],t['owner']['name'],t['owner']['id']])

print(f"Count all objects: {len(all_objects)}")

headers=['project_id','name','id','type','subtype','extType','dateCreated','dateModified','version','ownername','ownerid']
df = pd.DataFrame(all_objects, columns = headers)
print(df.head(3))


export_to_csv("All_Objects", df)


# #### Types and Subtypes


df = pd.DataFrame([[ob.value, ob.name] for ob in ObjectTypes] , columns = ['type_id', 'type_name'])
df = df[df.type_id > 0] # skip the 'None' type
df = df.astype({'type_id':'int'}) # convert float into integers
print(df.head(100))
export_to_csv("Types", df)

print()

df = pd.DataFrame([[ob.value, ob.name] for ob in ObjectSubTypes] , columns = ['subtype_id', 'subtype_name'])
df = df[df.subtype_id > 0] # skip the 'None' type
df = df.astype({'subtype_id':'int'}) # convert float into integers
print(df.head(10))
export_to_csv("Subtypes", df)


# #### Getting direct relations


# #### export direct relations to CSV


headers=['project_id', 'parent_id', 'parent_type', "rel_type", 'child_id', 'child_type']
df = pd.DataFrame(direct_deps, columns = headers)
df = df.astype({'child_type':'int'}) # convert float into integers

export_to_csv("Children_objects", df)


# #### Remove unwanted relations


direct_deps_cleaned=direct_deps[:]

# Let's remove subtotals - every metric has subtotals as components
# they inflate the result list, so we are going to get rid of them
subtotals=[t['id'] for t in objects if t['subtype']==1026]
print(f"Number of elements before removing subtotals: {len(direct_deps_cleaned)}")
s_list=[dd for dd in direct_deps_cleaned if dd[4] in subtotals]
direct_deps_cleaned=[dd for dd in direct_deps_cleaned if dd not in s_list]
print(f"Number of elements after removing subtotals: {len(direct_deps_cleaned)}")
print()

# Let's remove false relation table>attribute anbd table>fact
print(f"Number of elements before removing table relations: {len(direct_deps_cleaned)}")
sc_list=[dd for dd in direct_deps_cleaned if (dd[2]==15 and dd[5] in [12,13])]
direct_deps_cleaned=[dd for dd in direct_deps_cleaned if dd not in sc_list]
print(f"Number of elements after removing table relations: {len(direct_deps_cleaned)}")


# Let's remove attribute forms and columns - they don't have children
print(f"Number of elements before removing columns: {len(direct_deps_cleaned)}")
s_list=[dd for dd in direct_deps_cleaned if dd[5] in [21,26]]
direct_deps_cleaned=[dd for dd in direct_deps_cleaned if dd not in s_list]
print(f"Number of elements after removing columns: {len(direct_deps_cleaned)}")
print()


# #### Export to CSV


headers=['project_id', 'parent_id', 'parent_type', "rel_type", 'child_id', 'child_type']
df = pd.DataFrame(direct_deps_cleaned, columns = headers)
df = df.astype({'child_type':'int'}) # convert float into integers

export_to_csv("Children_objects_cleaned", df)


# #### Getting extended relations


# I will be using different lists to enravel extended dependencies
# TODO - review and simplify the flow

df = pd.read_csv("Children_objects_cleaned.csv")
direct_deps_cleaned=df.values.tolist()
direct_deps=direct_deps_cleaned[:]


all_deps = direct_deps_cleaned[:]
deps_to_be_checked=direct_deps_cleaned[:]


deps_to_be_checked=[d for d in deps_to_be_checked if d not in deps_checked]
deps_to_be_checked.extend(new_deps)


# #### Export to CSV


headers=['project_id', 'parent_id', 'parent_type', "rel_type", 'child_id', 'child_type']
df = pd.DataFrame(all_deps, columns = headers)
df = df.astype({'child_type':'int'}) # convert float into integers

export_to_csv("Children_objects_with_indirect", df)